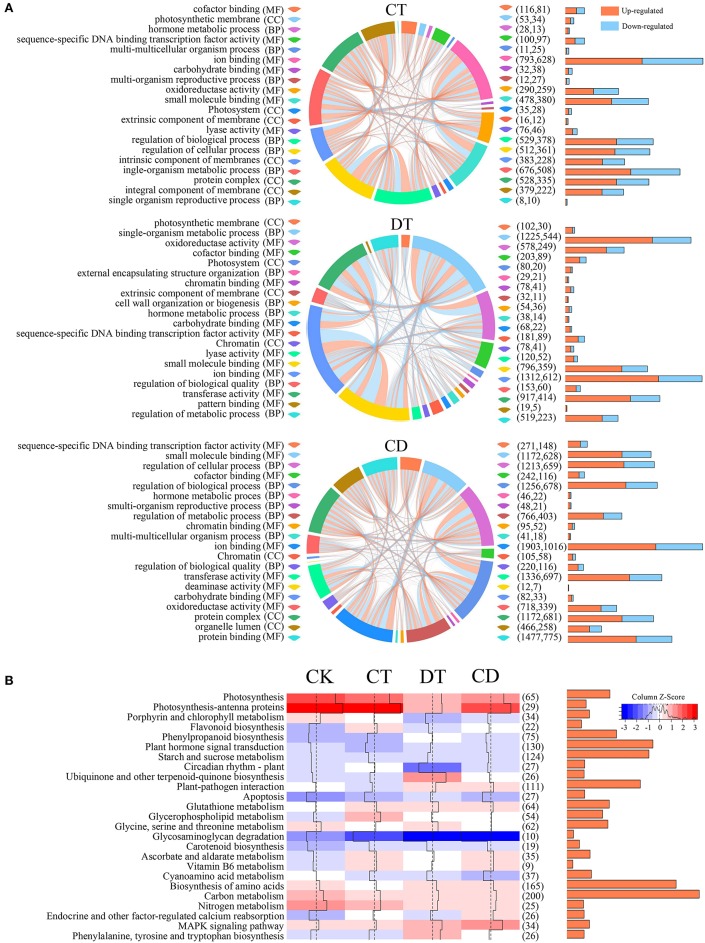
Figure 5.
GO and KEGG pathway analysis of DEGs under CT, DT, and CD. (A) Multi-series chord graphs for the top 20 level-3 GO terms of each stress treatment. The size of the segments around the circumference of the circle indicate the number of DEGs in specific GO terms. The orange (up-regulated) or blue (down-regulated) lines within the circle indicate the DEGs involved in different biological processes. The numbers of up- and down-regulated DEGs were shown in the right bar graphs and parentheses. (B) Heat map showing the overall expression levels of 25 enriched pathways during CT, DT, and CD. The color represents the mean expression values of DEGs within the pathways. The total numbers of DEGs in the pathways were shown in the right bar graphs and parentheses.

