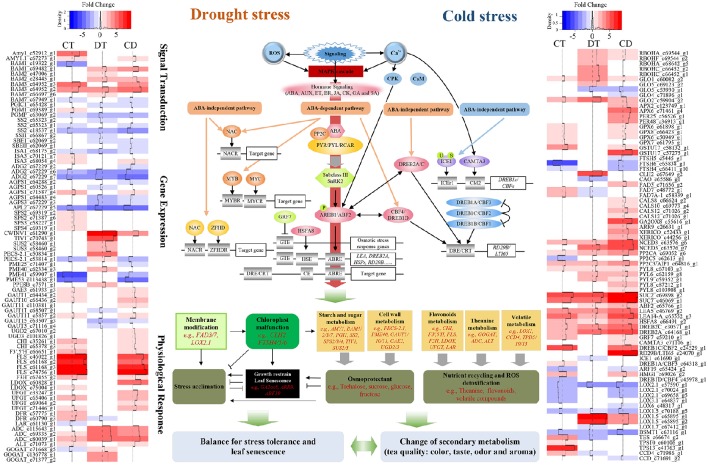
Figure 8.
Model representing the complex relationship between tea quality, leaf senescence and the responses to combined CD stress in C. sinensis. Sharp and blunt arrow denote activation and suppression, respectively. Heat maps show fold change of DEGs among the model during CT, DT, and CD. Full names of various genes are expanded in Supplementary Tables 11, 13.

