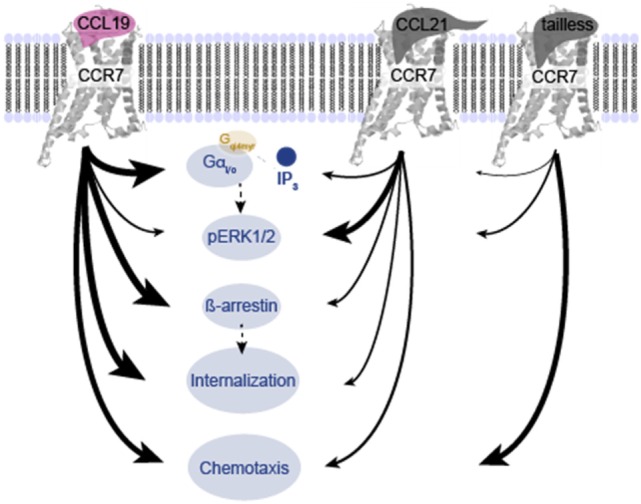
Figure 8.

Overview of differences in signaling induced by CCL19, CCL21, and tailless-CCL21. Schematic illustration of the relative effect of CCL19, CCL21, and tailless-CCL21 on diverse cellular effects presented in Figures 1–6. Thickness of arrows signifies effect, i.e., thick arrow, high activity; thin arrow, low activity.
