Figure 3.
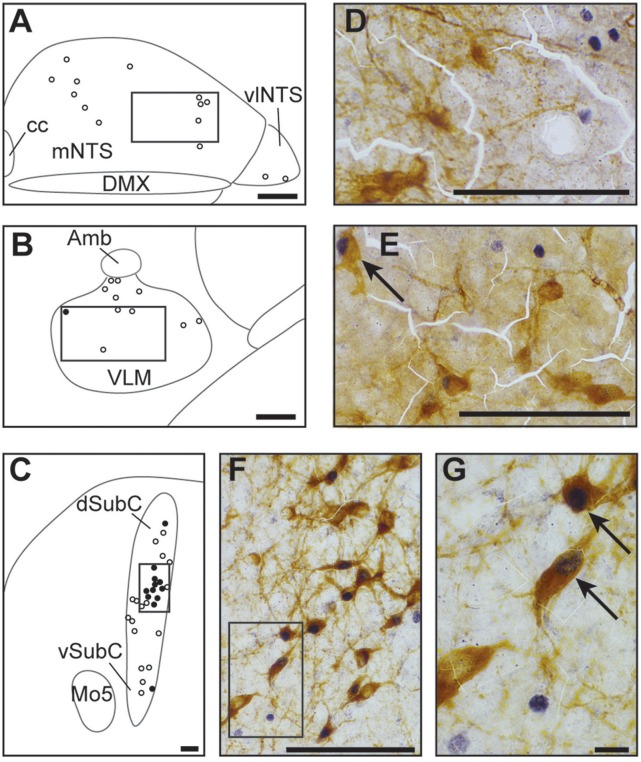
Catecholaminergic character of hypoxic c-FOS-positive cells of one-day-old mice. Drawings illustrating the distribution of cells immunoreactive for c-FOS (white points) or both c-FOS and TH (black points) in the mNTS, vlNTS (A), VLM (B), and dSubC and vSubC (C) under hypoxic conditions. Scale bar = 100 μm. Photomicrographs of sections double-immunolabeled for c-FOS (gray) and TH (brown) in the mNTS (D), VLM (E), and dSubC (F) corresponding to the regions outlined by the black rectangles in (A–C), respectively. Scale bar = 100 μm. (G) photomicrograph representing an enlargement of the black rectangle in (F) Scale bar = 10 μm. Black arrows indicate c-FOS-positive neurons that are also immunoreactive with TH. Amb: ambiguus nucleus; cc: central canal; DMX, dorsal motor nucleus of vagus; dSubC, dorsal part of the subcoeruleus nucleus; mNTS, median part of the nucleus of the tractus solitarius; Mo5, motor trigeminal nucleus; VLM, ventrolateral medullary reticular nucleus; vlNTS, ventrolateral part of the nucleus of the tractus solitarius; vSubC, ventral part of the subcoeruleus nucleus.

