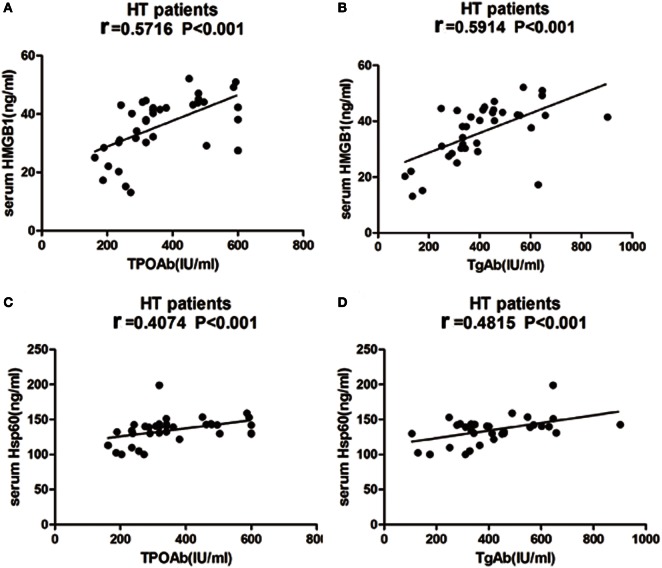
Figure 9.
Correlation analysis of laboratory parameters and serum levels of high mobility group box 1 (HMGB1) and heat shock protein 60 (HSP60) in HT patients. Relationship between serum expression of HMGB1 with TPOAb (A) and TgAb (B), HSP60 with TPOAb (C) and TgAb (D) are presented in scatter plots. Pearson’s and Spearman’s correlation and P-values are given in all cases, r = Pearson correlation coefficient. HT, Hashimoto’s thyroiditis.

