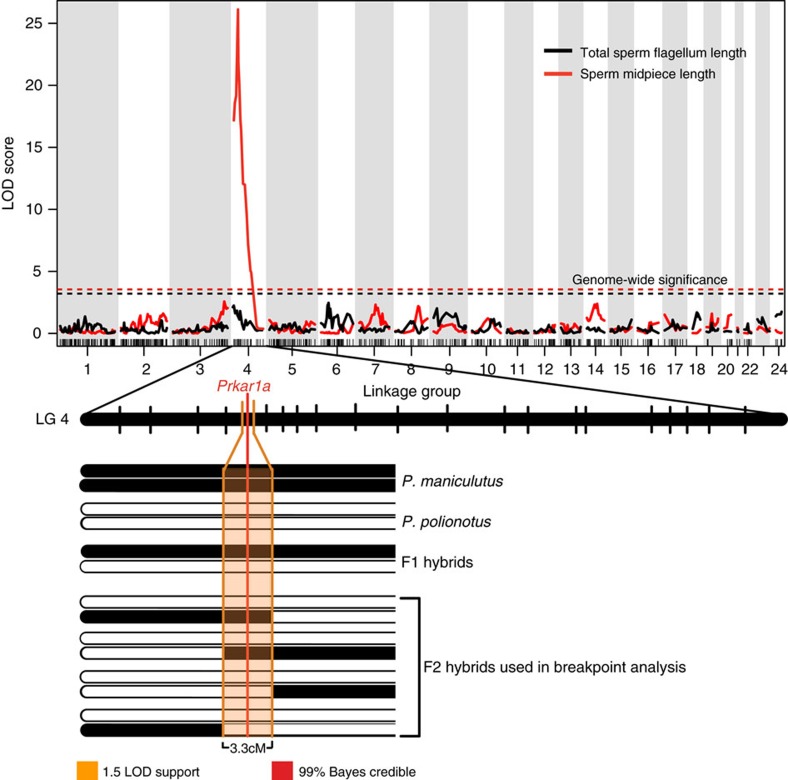
Figure 3. Genetic mapping of sperm morphology.
Association between genome-wide SNP markers and total sperm flagellum length (black) and midpiece length (red). Genome-wide significant LOD thresholds for each trait (from 10,000 permutations; α=0.01) indicated by dashed lines. A zoomed in view of Linkage Group 4 (LG4) shows confidence thresholds for QTL associated with midpiece length; 1.5 LOD support interval is shown in orange, the 99% Bayes credible interval is shown; position of the most highly associated gene. Prkar1a, is given. F2 hybrids with recombination events within the 1.5-LOD support threshold (n=11) were used for breakpoint analysis.

