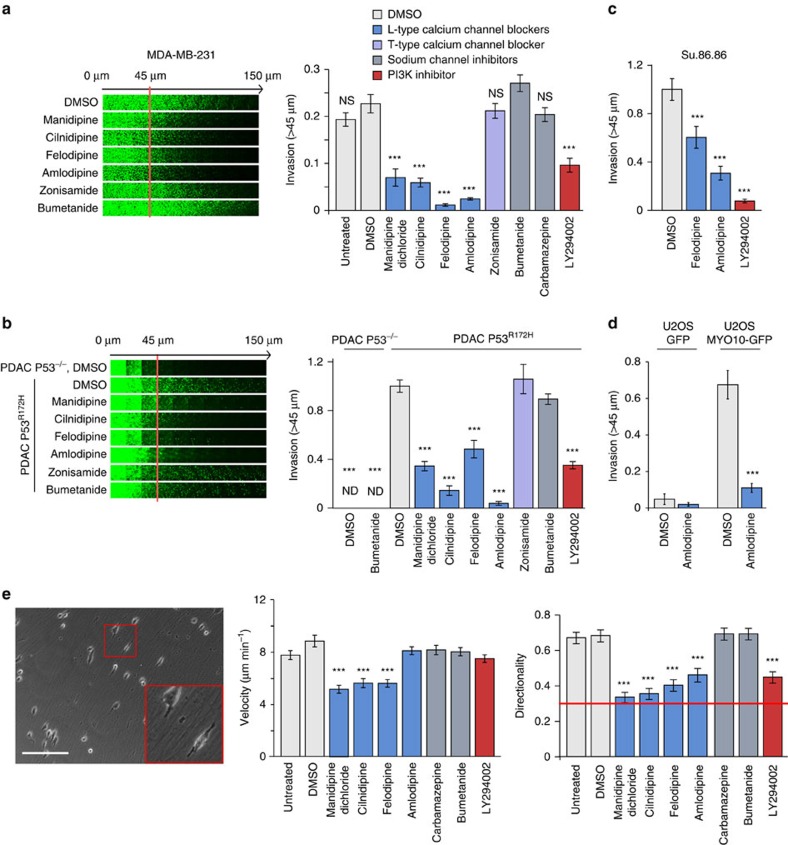
Figure 2. L-type calcium channels regulate filopodia formation and cancer cell invasion.
(a) MDA-MB-231 cells were seeded into an inverted invasion assay in the presence of various compounds (10 μM) where indicated for 48 h. The relative invasion over 45 μm was quantified (n=three biological repeats, ***P value<1.3 × 10⁻⁵). (b) P53−/− and P53R172H PDAC cells were seeded into an inverted invasion assay in the presence of various compounds (10 μM) for 4 days. The relative invasion over 45 μm was quantified (n=three biological repeats, ***P value<4.1 × 10⁻⁸). (c) Su.86.86 pancreatic carcinoma cells were seeded into an inverted invasion assay and allowed to invade for 4 days in the presence of various compounds (10 μM). Relative invasion over 45 μm was quantified (n=three biological repeats, ***P value<9 × 10⁻³). (d) U2OS cells stably expressing either GFP or MYO10-GFP were seeded into an inverted invasion assay and allowed to invade for 4 days in the presence of amlodipine besylate (10 μM) or DMSO. Relative invasion over 45 μm was quantified (n=three biological repeats, ***P value<4.05 × 10⁻⁶). (e) MDA-MB-231 cells were seeded on fibroblast-generated cell derived matrices (representative image is shown) in the presence of various compounds (10 μM), and cell migration was recorded over 24 h. Over 65 cells were manually tracked for each condition and migration speed and directionality were measured (n=two biological repeats, scale bar, 200 μm; ***P value<2.6 × 10⁻⁵). P values were calculated using Student's t-test (unpaired, two-tailed, unequal variance). All error bars represent s.e.m.

