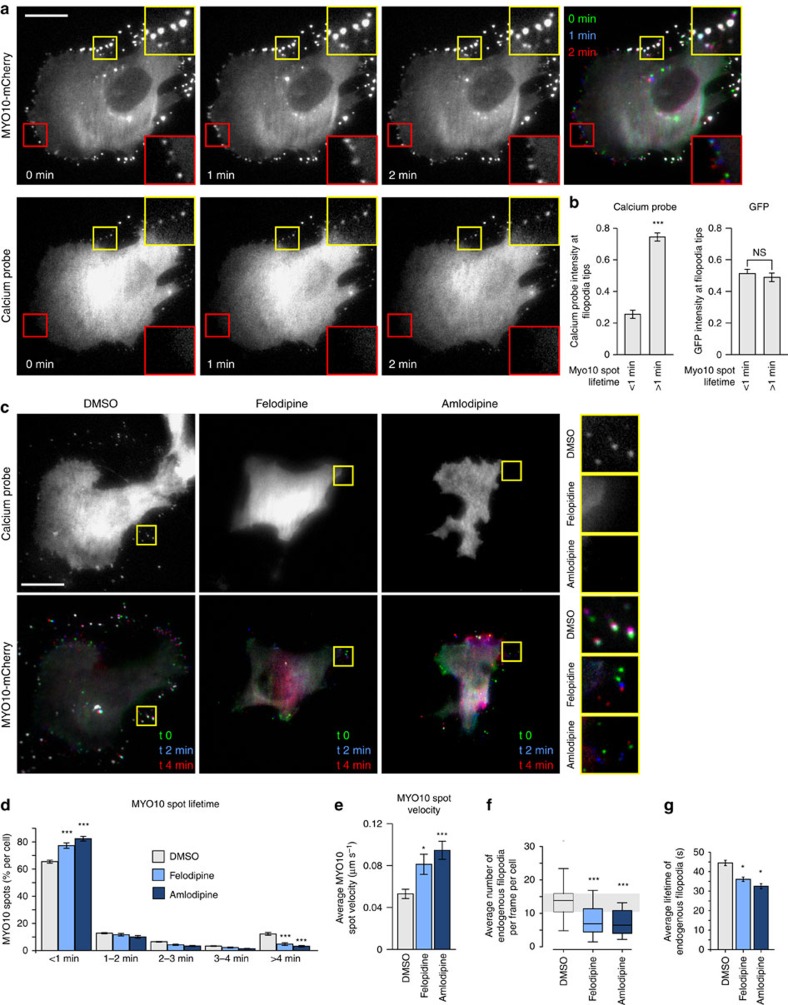
Figure 4. Calcium at filopodia tips regulates filopodia stability.
(a) MDA-MB-231 cells transiently expressing the calcium probe (pGP-CMV-GCaMP6s) and MYO10-mCherry were plated on FN and imaged live using a TIRF microscope (1 picture every 5 s; scale bar, 20 μm). The intensity of the calcium probe at MYO10-positive filopodia tips was measured and compared between transient (<1 min lifetime) and stable filopodia (>1 min lifetime) (n=276 filopodia, three biological repeats, ***P value<1.8 × 10⁻⁹). (b) MDA-MB-231 cells transiently expressing GFP and MYO10-mCherry were plated on FN and imaged live using a TIRF microscope. The intensity of GFP at MYO10-positive filopodia tips was measured and compared between transient and stable filopodia (n=293 filopodia, three biological repeats). (c–e) MDA-MB-231 cells transiently expressing the calcium probe (pGP-CMV-GCaMP6s) and MYO10-mCherry were plated on FN, treated with DMSO, felodipine or amlodipine besylate (10 μM) and imaged live using a TIRF microscope (1 picture every 5 s; scale bar, 20 μm). Representative images are shown (c). For each condition, MYO10-positive particles were automatically tracked and MYO10 spot lifetime (calculated as a percentage of the total number of filopodia generated per cell) (d) and average MYO10 spot velocity (e) were plotted (see method for details; three biological repeats, n>5,600 particles tracked in more than 16 cells, *P value=0.015, ***P value<2.98 × 10⁻⁵). (f,g) MDA-MB-231 cells transiently expressing lifeact-GFP were plated on FN, treated with DMSO, felodipine or amlodipine besylate (10 μM), and imaged live on a TIRF microscope. Movies were segmented and endogenous filopodia automatically identified using CellGeo51 (See method for details). Average filopodia number per frame and per cell (f) and average filopodia lifetimes are displayed (g) (n>16 cells, two biological repeats; *P value=0.035, ***P value<5.6 × 10⁻⁵). P values were calculated using Student's t-test (unpaired, two-tailed, unequal variance). All error bars represent sem.

