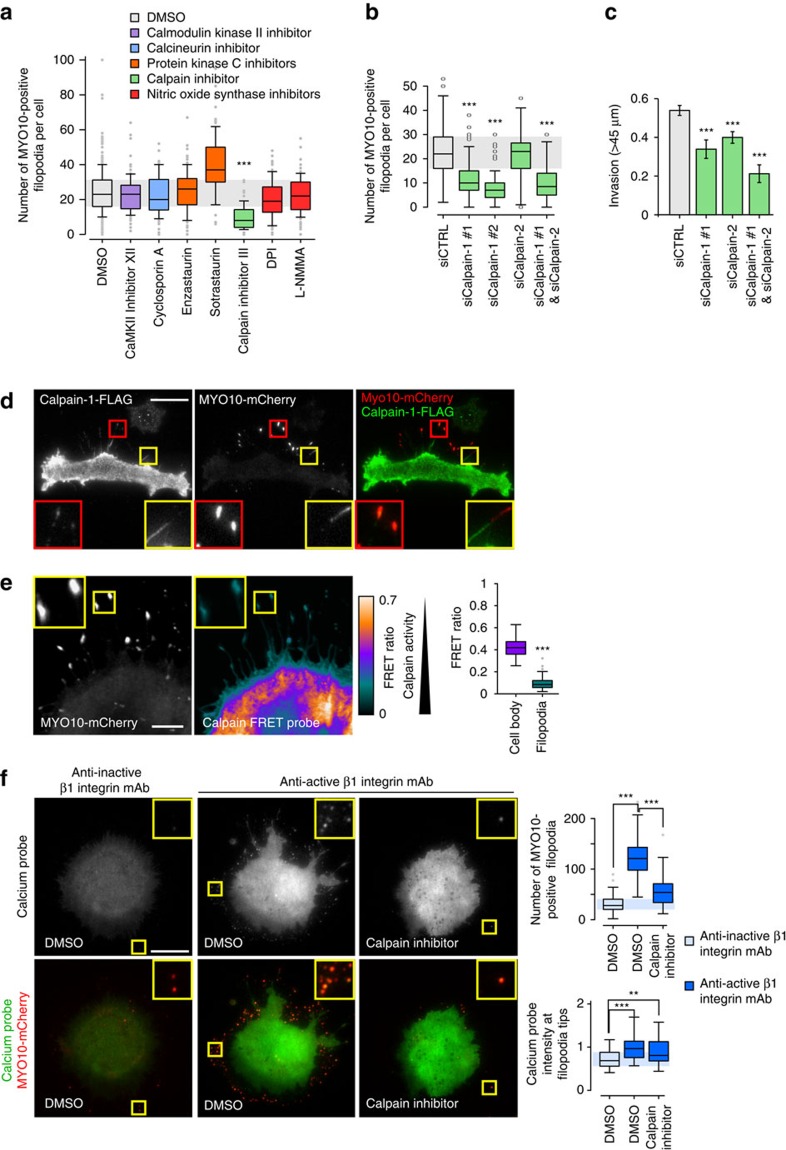
Figure 7. Calpain-1 regulates filopodia formation.
(a) MDA-MB-231 cells transiently expressing MYO10-GFP were plated on FN, treated for 1 h with various inhibitors (10 μM with the exception of cyclosporin A, enzastaurin and sotrastaurin used at 1 μM) directed against calcium-regulated pathways, fixed and imaged on a TIRF microscope. The number of MYO10-positive filopodia per cell was counted (n>86 cells, three biological repeats; ***P value<2.4 × 10⁻²⁴). (b) MDA-MB-231 cells previously silenced for calpain-1, using two distinct siRNA, and/or for calpain-2, and transiently expressing MYO10-GFP, were plated on FN for 2 h, fixed and the number of MYO10-positive filopodia per cell was quantified (n>62 cells, three biological repeats; ***P value<4.01 × 10⁻¹¹). (c) MDA-MB-231 cells previously silenced for calpain-1 and/or for calpain-2 were seeded into an inverted invasion assay and allowed to invade for 48 h. Relative invasion over 45 μm was quantified (three biological repeats, *** P value<1.2 × 10⁻⁴). (d) MDA-MB-231 cells transiently expressing MYO10-mCherry and FLAG-calpain-1 were plated on FN for 2 h, stained with an anti-FLAG antibody and imaged on a TIRF microscope (scale bar, 20 μm). (e) MDA-MB-231 cells transiently expressing MYO10-mCherry and a calpain FRET probe (pCMV-calpainsensor; CFP and YFP linked by a calpain cleavage site, low FRET=higher calpain activity) were plated on FN and imaged on a confocal microscope (scale bar, 5 μm). The averaged FRET ratios measured in filopodia and in the cell body are displayed (three biological repeats, cell body n=23, filopodia n=236; ***P value<8.9 × 10⁻¹⁵). Controls relative to this FRET experiment are presented in Supplementary Fig. 11. (f) MDA-MB-231 cells transiently expressing MYO10-mCherry and the calcium probe were plated on conformation-specific anti-β1 integrin antibodies (as in Fig. 5g) in the presence of DMSO or a calpain inhibitor (10 μM) (scale bar, 20 μm). The number of MYO10-positive filopodia per cell and the calcium probe intensity at filopodia tips were measured (n>74 cells, three biological repeats; **P value<4.3 × 10⁻³, ***P value<3.06 × 10⁻⁶). P values were calculated using Student's t-test (unpaired, two-tailed, unequal variance).

