
Figure-3.
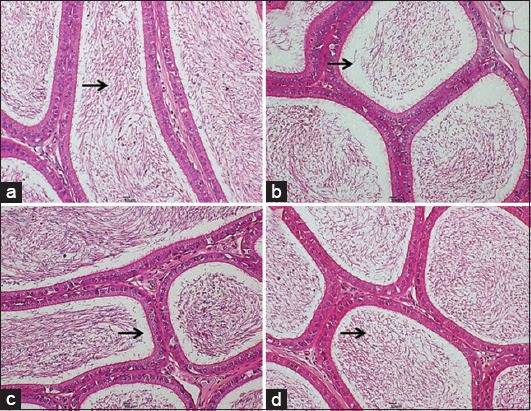
Photomicrograph section of the epididymal tail from (a) Control group, showing optimal epididymal sperm reserve (ESR) of 80-90% (black arrow), (b) positive control group, showing reduced ESR of 60-70% with sparse distribution of sperms (black arrow), (c) T1 group, showing marked distribution of sperms appearing as dense fibers within the lumen (black arrow), (d) T2 group, showing good ESR with moderate sperms distribution (black arrow) (H and E, 200×).