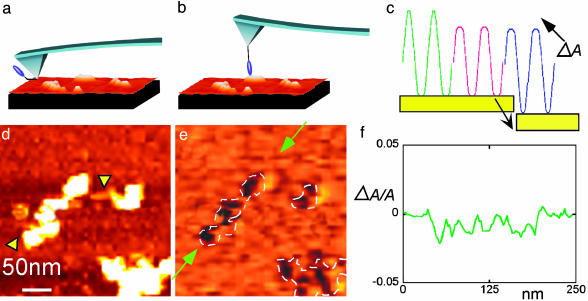
Fig. 1.
Recognition imaging. When an AFM tip-tethered antibody (blue blob in a) binds to its antigen in the sample being scanned (b), there is a transient reduction in the oscillation amplitude of the tip (green curve to red curve in c). The imaging servo restores the signal amplitude but with the peak signal shifted downward by an amount ΔA (blue curve in c). This peak shift provides the recognition signal for a specific antigen–antibody recognition event. A topographic image of MMTV arrays and the corresponding recognition image (a “map” of the change in peak signal, ΔA) are shown in d and e, respectively. These images were obtained simultaneously from one scan of the sample by using an H3-specific antibody tethered to the AFM tip. A plot of the peak signal, ΔA, for the portion of the recognition image between the green arrows (e) is shown in f. The dips in signal correspond well with the location of nucleosomes, and the changes in peak signal (traced in f) are in quantitative agreement with theory (see text). The x–y scale is shown in d. The highest features in d are ≈5 nm.

