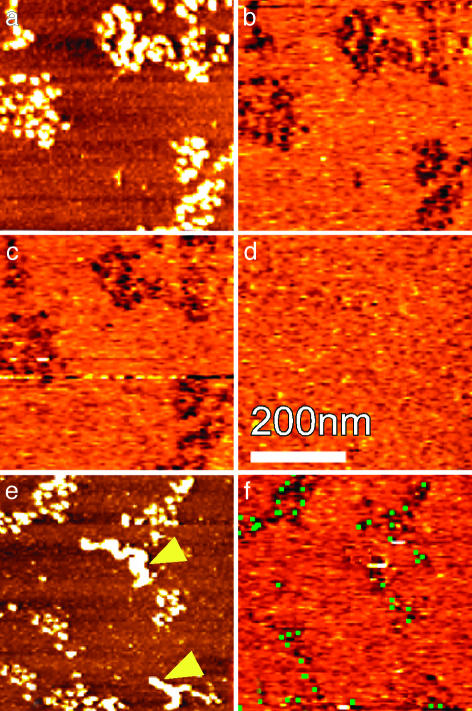
Fig. 2.
The specificity of recognition imaging. Topographic (a) and recognition (b) images of MMTV nucleosomal arrays similar to those shown in Fig. 1 are shown. Recognition images from the same region of the sample taken after addition of BSA into the sample in the flow cell (c) and then after the addition of ARTKQTARKSTGGKAPRKQLC (which corresponds to the N-terminal tail of histone H3) (d) are also shown. (e) Topographic image of a field with BSA aggregates pointed to by yellow arrowheads. (f) Recognition images of this same field after BSA was added. The recognition image obtained before BSA addition is superimposed on the recognition signal after BSA addition as green dots. The coincidence of the green dots and dark spots demonstrates that the added BSA did not interfere with the H3 recognition.

