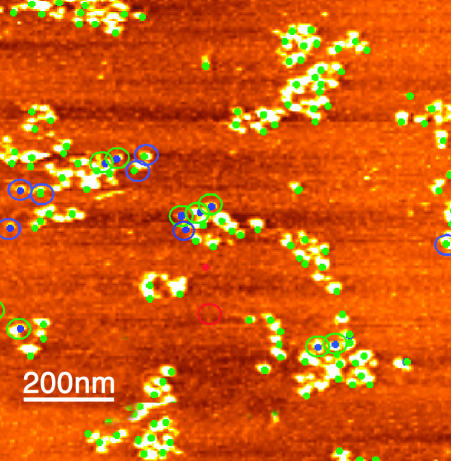
Fig. 4.
The efficiency and repeatability of recognition imaging. Spots from a recognition image are superimposed (as green dots) on its corresponding topographic image. Features present in the topographic image but not in the recognition image are marked by blue dots. A recognition feature with no corresponding topographic feature (near middle of the image) is marked by a red spot. Changes in recognition events after rescanning are indicated by the circles color-coded with the same scheme (no circle equals no change after rescanning). For example, a feature recognized in the first scan but not in the second is shown by a green dot (recognition in the first scan) surrounded by a blue circle (not recognized on the second scan). The recognition efficiency generally remains >90%.

