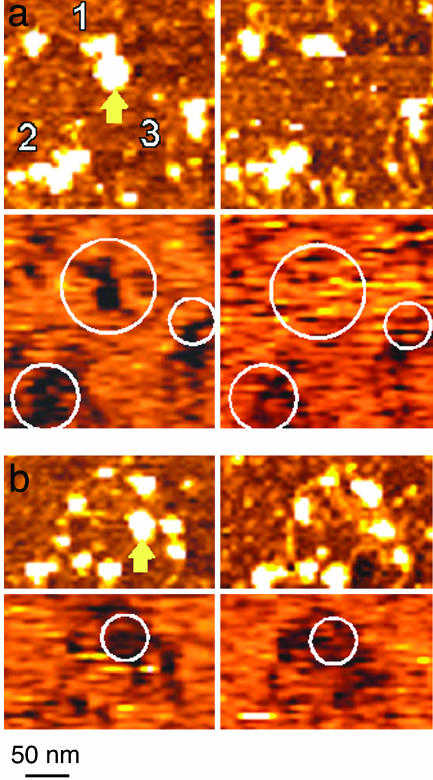
Fig. 5.
Using recognition imaging to study a complex, biologically relevant process. Some examples of the changes seen after hSwi-Snf activation (by ATP) in deposited MMTV nucleosomal arrays are shown. a and b Upper shows topographic images taken before (Left) and after (Right) ATP addition. a and b Lower shows corresponding recognition images obtained with an anti-H3 tip. Protein loss on ATP addition (yellow arrows in the –ATP images) is accompanied by loss of the recognition signal showing that the lost features were likely not hSwi-Snf. Molecules labeled 2 and 3 in a appear unchanged in the topographic image but show loss of recognition signal after ATP addition. (The scale shown at the bottom applies to all the images.)

