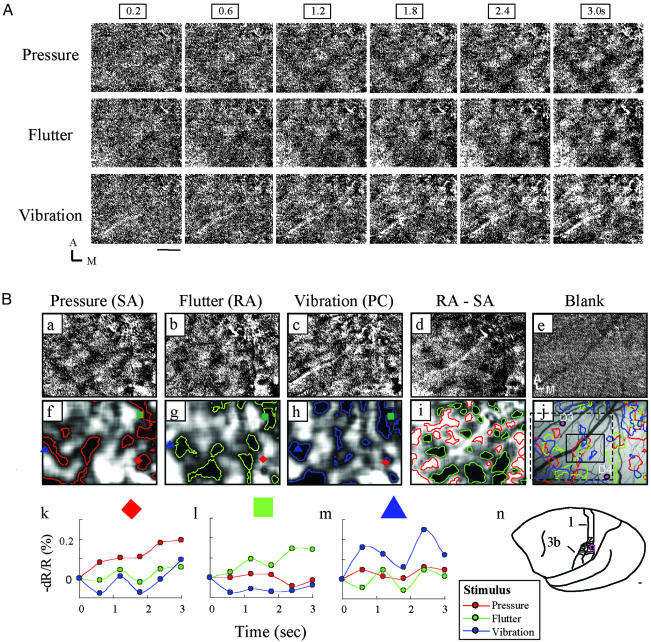
Fig. 1.
Vibrotactile stimulation of D4 evokes modality-specific activation in area 1. (A) Temporal development and consistency of the intrinsic cortical response to pressure, flutter, and vibratory stimuli. Dark pixels indicate activation. For each stimulus, six images spanning 3 sec are shown (stimulus onset at frame 0.2 sec). (Scale bar, 1 mm.) A, anterior; M, medial. Data are the sum of 40 trials. (B) Single-condition blank-subtracted maps show modality-specific activation patterns. (a-c) Same as last images shown in A (3 sec). (d and i) Subtraction maps of flutter-pressure (RA-SA) illustrate irregular alternating dark (preference for flutter) and light (preference for pressure) domains (gray pixels indicate equal preference for both). (e) Blank condition map. (f-i) Activation outlines of a-d obtained by low-pass filtering and thresholding. The red diamond, green square, and blue triangle indicate sampled locations in k-m.(j) Blood vessel map with pressure, flutter, and vibration activation outlines superimposed. Sample electrode penetrations are indicated by labeled dots. The black box indicates the region shown in Fig. 3C. (k-m) Time courses of signal reflectance change illustrate modality-specific preference: pressure-dominant locus (red diamonds), flutter-dominant locus (green squares), and vibration-dominant locus (blue triangles). (n) Location of fingerpad representation in area 1 in the squirrel monkey (adapted from ref. 45). Small red box indicates area of imaging. Data are the sum of 40 trials. (Scale bar, 1 mm.)

