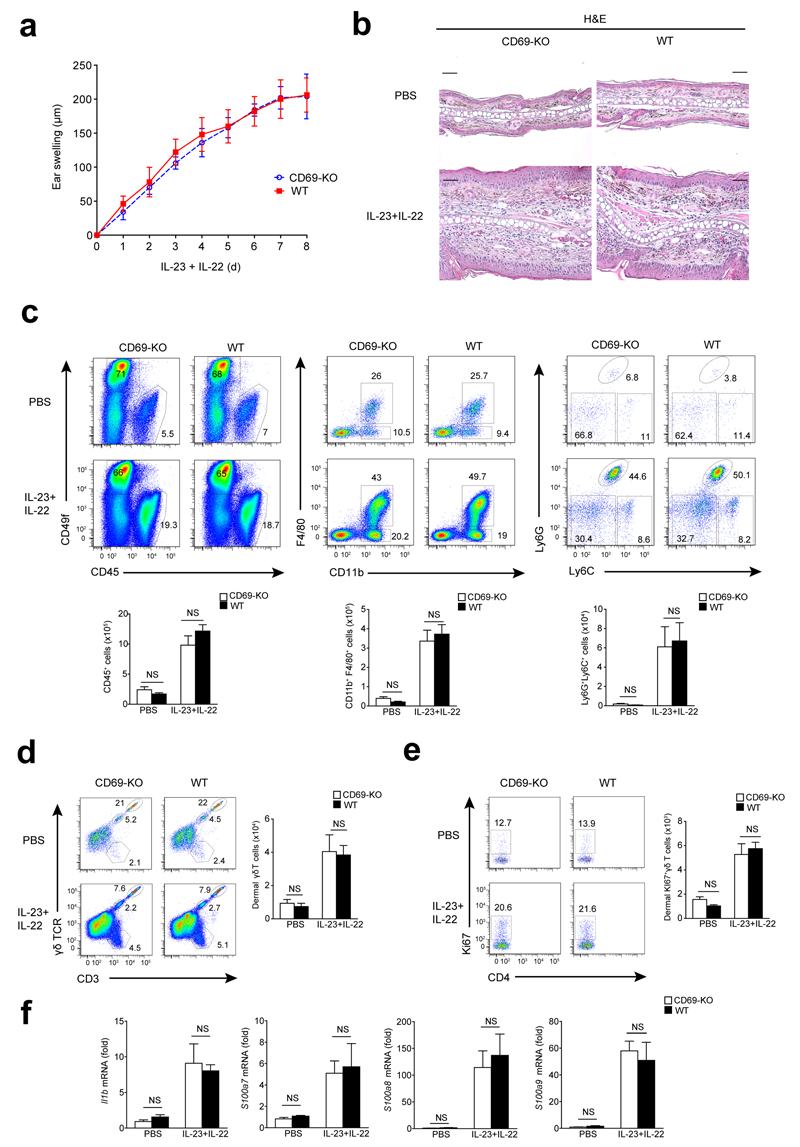
Figure 4. IL-22 mediates skin inflammation downstream of CD69.
(a) Analysis of ear thickness during administration of 8 doses of IL-23 plus IL22 (500 ng of each) in CD69-deficient (CD69-KO) and wild-type (WT) mice. Data is the mean ± SD; (n=6 mice). This experiment was independently replicated with similar results. (b) Representative H&E-stained sections of PBS or IL-23+IL-22-treated ears of WT and CD69-KO. Scale bars indicated 50 µm (20X). (c) Representative dot plots indicating percentages (%) in the skin suspensions of CD45+ cells, keratinocytes (CD49f+), macrophages (CD45+CD11c-CD11b+F4/80+) and neutrophils (CD11b+F4/80-Ly6G+Ly6C+). Bar charts indicate total number of CD45+ cells, macrophages and neutrophils quantified per ears. (d) Representative dot plots indicating percentages in the skin suspensions of CD3+ populations: CD3+γδ- T cells, CD3+γδ+ dermal T cells, and CD3++γδ++ epidermal T cells. Bar chart indicates total number of dermal γδ T cell population detected per ear. (e) Ki67+ dermal γδ T cells percentages and total number in the skin is showed in the dot plots and bar chart, respectively. (f) Analysis of Il1b, S100a7-8-9 mRNA expression in the skin. Bars denote the mean ± SEM and data were analyzed with two-way ANOVA and Bonferroni multiple comparison test. NS, not significant.

