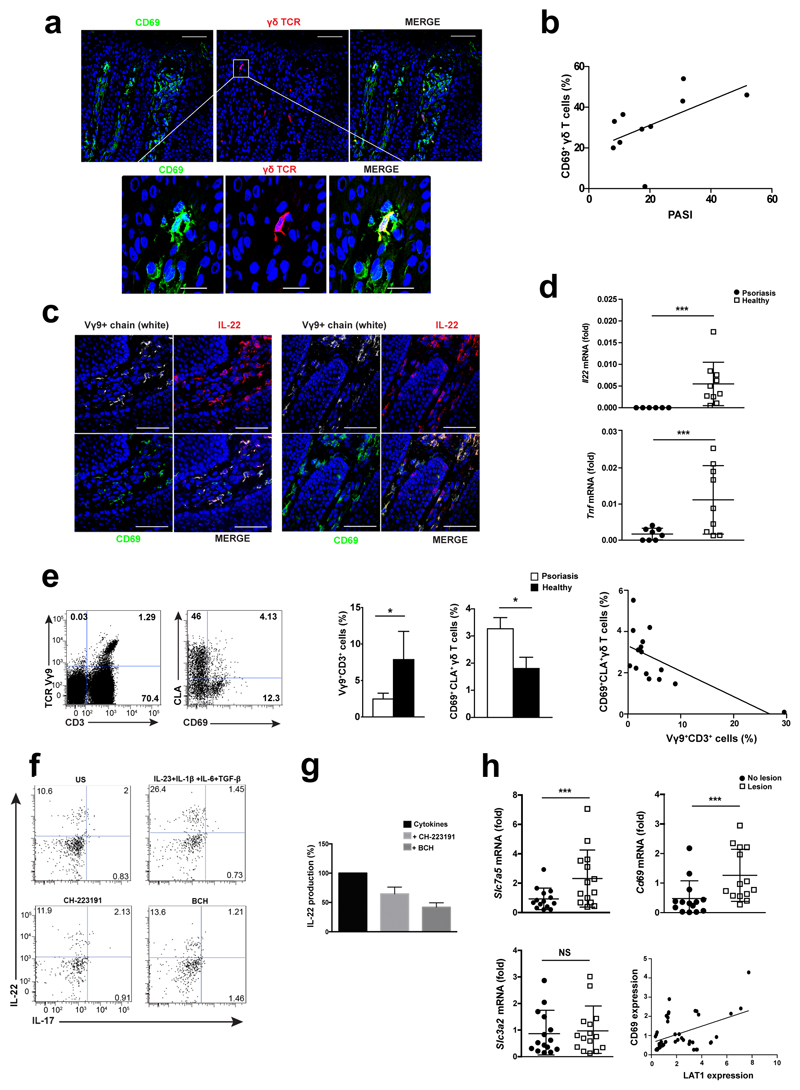
Figure 8. CD69 expression is detected in skin and circulating Vγ9+ T cells from psoriatic patients.
(a) Representative frozen section of human psoriatic lesion immunostained for CD69 (green), γδTCR (red) and nuclei (DAPI-blue). (b) Correlation between dermal Vγ9+CD69+ T cells (%) and the clinical Psoriasis Area Severity Index (PASI) of patients, Spearman test, r=0.64, p<0.05, (n=10). (c) Representative frozen sections from psoriatic lesions immunostained against Vγ9+ chain (white), IL-22 (red) and CD69 (green). Scale bar indicated 50µm and 25µm for zoom. (d) RT-PCR analysis of Il22 and Tnf mRNA in lesional skin (n=10) vs healthy subjects (n=9). (e) Flow cytometry of PBMCs from psoriatic (n=9) and healthy (n=6) subjects indicating CD3+Vγ9+ gated cells and expression of CLA and CD69. Bars showed percentage of CD3+Vγ9+ cells and analysis of CD69 expression in skin homing CLA+Vγ9 circulating T cells (n=14). (f-g) Peripheral γδ T cells from psoriatic patients were expanded and stimulated to release IL-22 in L-Trp supplemented medium. Addition of CH-223191 and BCH was assessed by flow cytometry and confirmed by ELISA (n=3). (h) Analysis of Slc7a5, Cd69 and Slc3a2 in the lesion and non-lesional area from psoriatic patients (n=14). Correlation analysis (r=0.34; p=0.02) between Cd69 and Slc7a5 is indicated. Each dot indicates one patient, and horizontal bars denote the mean ± SD of scatter plots. Graphic bars represent the mean ± SEM and data was analyzed with unpaired t-test. NS, not significant; * P < 0.05, *** P < 0.001.

