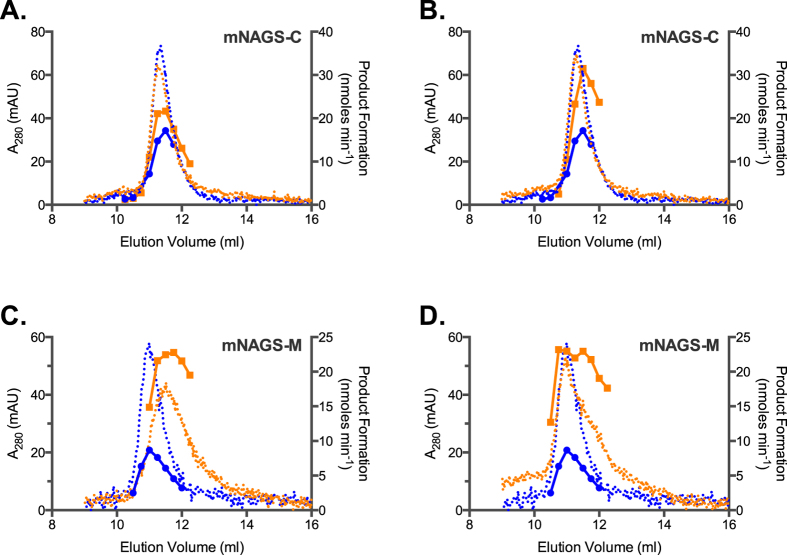
Figure 10. Elution profiles of mNAGS-C and and mNAGS-M.
(A and C) mNAGS-C and mNAGS-M that were allowed to equilibrate overnight with and without L-arginine. (B and D) mNAGS-C and mNAGS-M did not equilibrate with L-arginine prior to loading onto column. Absorption at 280 nm (dotted lines) and rate of product formation (solid lines) were measured as functions of elution volume in the absence (blue) or presence (orange) of L-arginine.

