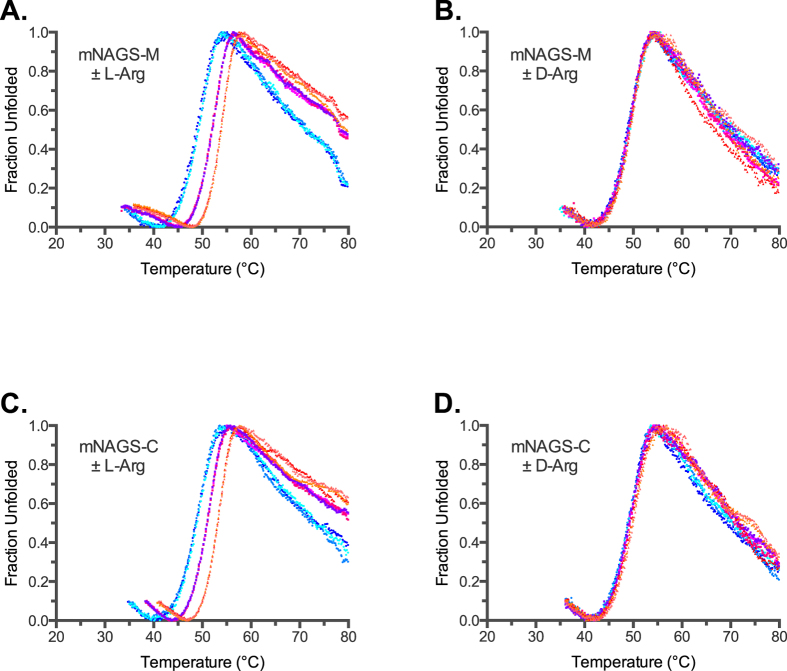
Figure 3. Thermofluor analysis of mouse NAGS in the presence and absence of L- and D-arginine.
Unfolding of mNAGS-M was measured in the presence of increasing concentrations of either L-arginine (A) or D-arginine (B). Unfolding of mNAGS-C was measured in the presence of increasing concentrations of either L-arginine (C) or D-arginine (D). Cyan and blue – thermal unfolding in the absence of L- or D-arginine. Magenta - thermal unfolding in the presence of 1 mM L- or D-arginine. Orange - thermal unfolding in the presence of 10 mM L- or D-arginine.

