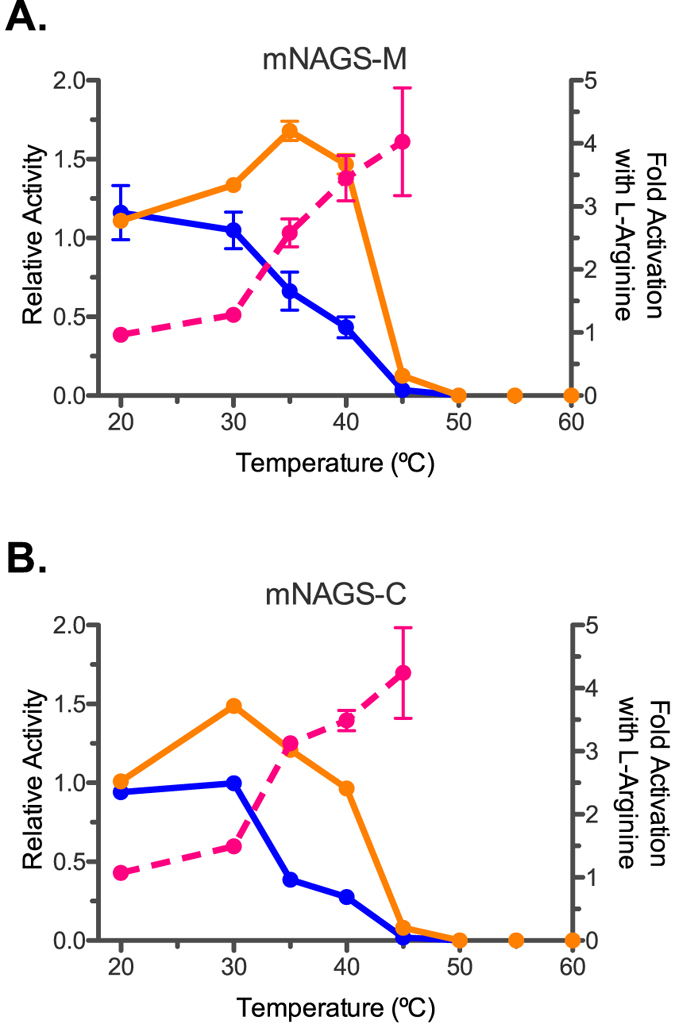
Figure 4.

Thermal inactivation of mNAGS-M (A) and mNAGS-C (B). Specific NAGS activity was normalized to specific activity measured after incubation at 30 °C. Blue – relative synthase activity in the absence of L-arginine after incubation without L-arginine. Orange – relative synthase activity in the presence of 1 mM L-arginine after incubation with 1 mM L-arginine. Magenta – fold-increase of specific NAGS activity in the presence of 1 mM L-arginine.
