
Figure 6. Analytical ultracentrifugation of the XcNAGS-K.
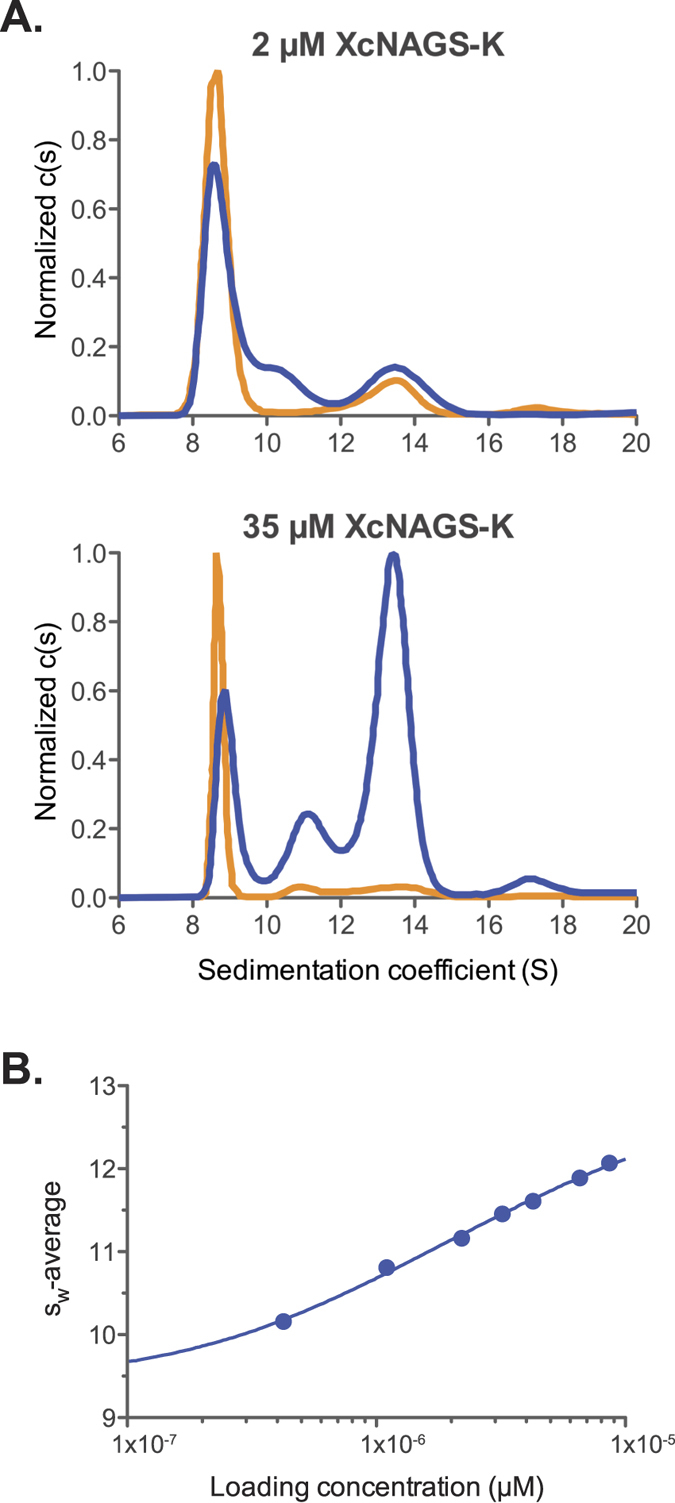
(A) Distribution of sedimentation coefficients c(s) in the absence (blue) and presence (orange) of L-arginine at two different protein concentrations. Molar concentrations refer to the concentration of XcNAGS-K monomer. (B) The Sw isotherm for XcNAGS-K in the absence of arginine showing the concentration dependence of the weight-average sedimentation coefficient in the c(s) distributions integrated between 7 and 16 S (solid circles) in overlay with the best-fit curve describing a tetramer-octamer association model.