Figure 8.

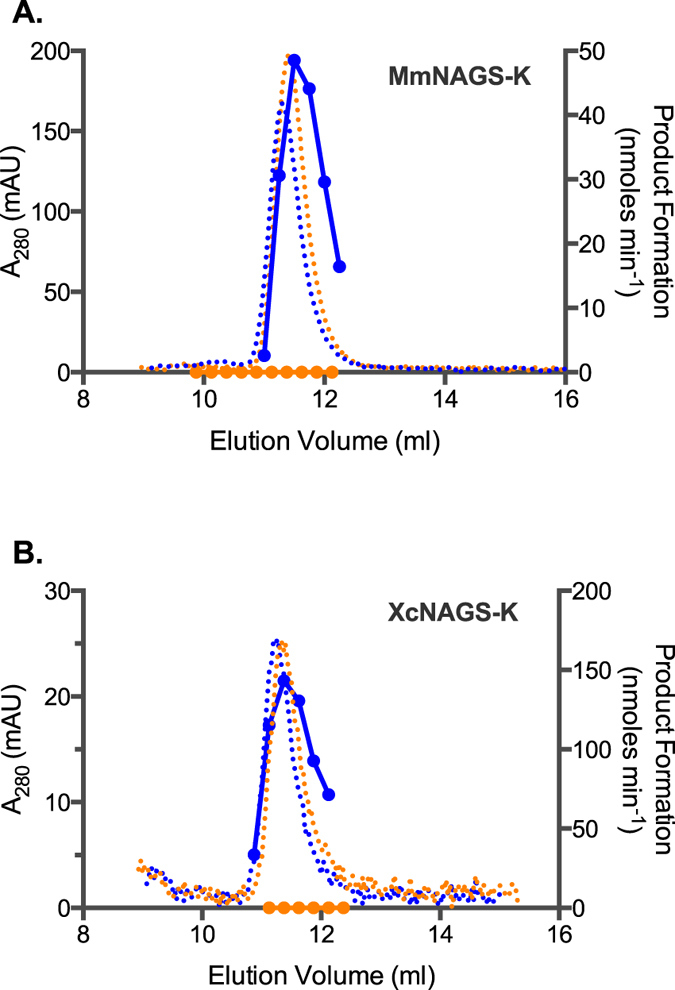
Elution profiles of MmNAGS-K (A) and XcNAGS-K (B). Absorption at 280 nm (dotted lines) and rate of product formation (solid lines) were measured as functions of elution volume in the absence (blue) or presence (orange) of L-arginine.

Elution profiles of MmNAGS-K (A) and XcNAGS-K (B). Absorption at 280 nm (dotted lines) and rate of product formation (solid lines) were measured as functions of elution volume in the absence (blue) or presence (orange) of L-arginine.