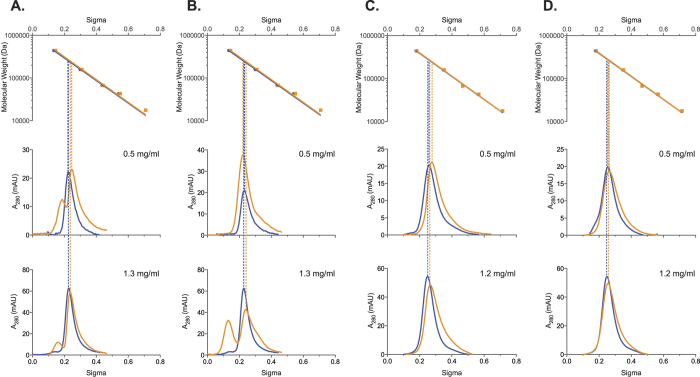
Figure 9. Analytical gel chromatography of mNAGS-C and mNAGS-M.
(A and C) mNAGS-C and mNAGS-M that were allowed to equilibrate overnight at indicated protein concentrations with and without L-arginine. (B and D) mNAGS-C and mNAGS-M were diluted immediately before loading onto column and did not equilibrate with L-arginine prior to loading onto column. The top panels show a semi-logarithmic plot of molecular mass vs. elution volume of size and molecular weight standard proteins. Lower panels show absorption at 280 nm as a function of elution volume and protein concentration. Blue - elution profiles in the absence of L-arginine. Orange – elution profiles in the presence of 1 mM L-arginine.

