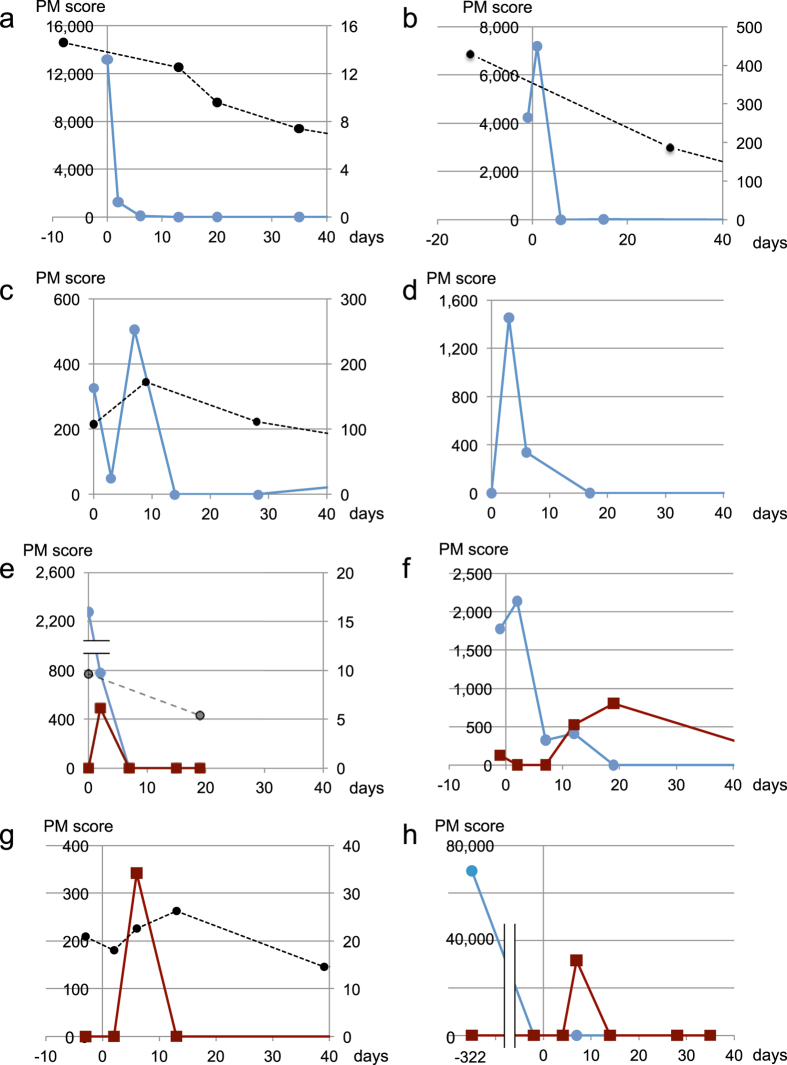
Figure 1. ctDNA dynamics in the early period of EGFR-TKI treatment.
The vertical axis displays the PM score for EGFR mutations (left) or the concentration (μg/mL) of the carcinoembryonic antigen (CEA) (right). The horizontal axis displays the number of days after the initiation of the EGFR-TKI treatment. Blue lines indicate ctDNA with activating mutations identified in biopsy samples (exon 19 deletion or L858R). Wine red lines represent activating mutations absent from biopsy samples. Black broken lines represent CEA values. PM scores that did not exceed LOD, and CEA scores lying within the normal range are not displayed in the graphs. (a) Patient E1; (b) Patient E2; (c) Patient E3; (d) Patient E4; (e) Patient E5; (f) Patient E6; (g) Patient E7; (h) Patient E8. Clinical information on patients E1-E4, (age, sex, stage, EGFR-TKI, initial response, mutations in biopsy samples) are as follows: E1 (81, F, IV, erlotinib, PR, L858R); E2 (54, F, IV, gefitinib, PR, L858R); E3 (69, M, IV, gefitinib, PR, exon 19 deletion); E4 (56, F, IIA, gefitinib, NE, exon 19 deletion). Information on patients E5-E8 is presented in Table 1.

