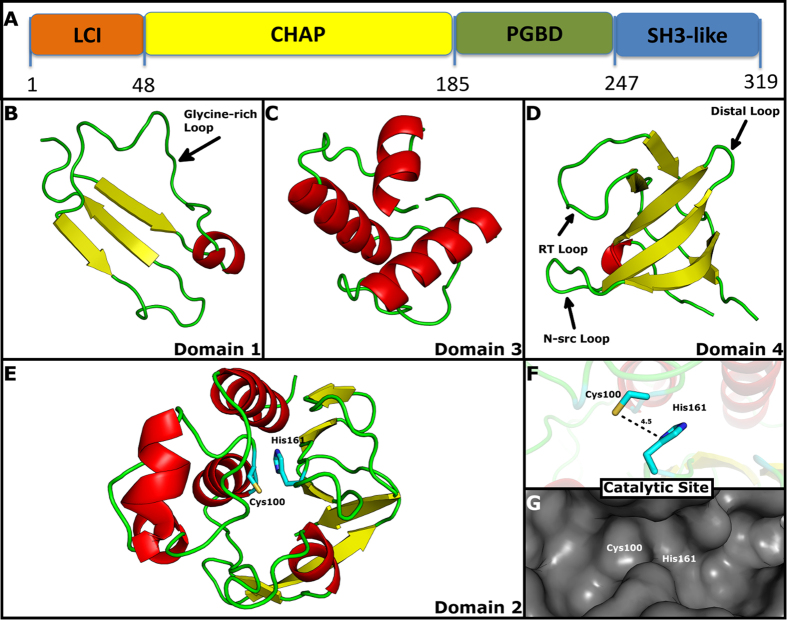
Figure 2. Cartoon representations of homology models of individual PCP domains.
Alpha helices are colored in red and beta strands in yellow. (A) Domain 1 (residues 1-48), N-terminal domain is depicted in orange; Domain 2 (residues 49-185), the catalytic CHAP domain, in yellow; Domain 3 (residues 186-247), the peptidoglycan binding domain, in green; and Domain 4 (residues 248-319), the SH3 domain, in blue. (B) The N-terminal Domain 1 presenting an LCI fold. The arrow points to the glycine-rich loop observed in this fold. (C) Domain 3 presenting three alpha helices organized in a conserved PGBD fold. (D) The C-terminal Domain 4 presenting an SH3 conserved fold with its functional loops emphasized. (E) Domain 2 presenting the conserved structural features of a catalytic CHAP domain with a six-strand beta sheet (located to the right) packed against a group of alpha helices (located to the left). The catalytic residues, Cys100 and His161, are also shown. (F) Close-up on the catalytic site residues of Domain 2 and their respective distances. (G) Surface of the Domain 2 catalytic pocket showing the substrate cleft and catalytic residues’ positions.

