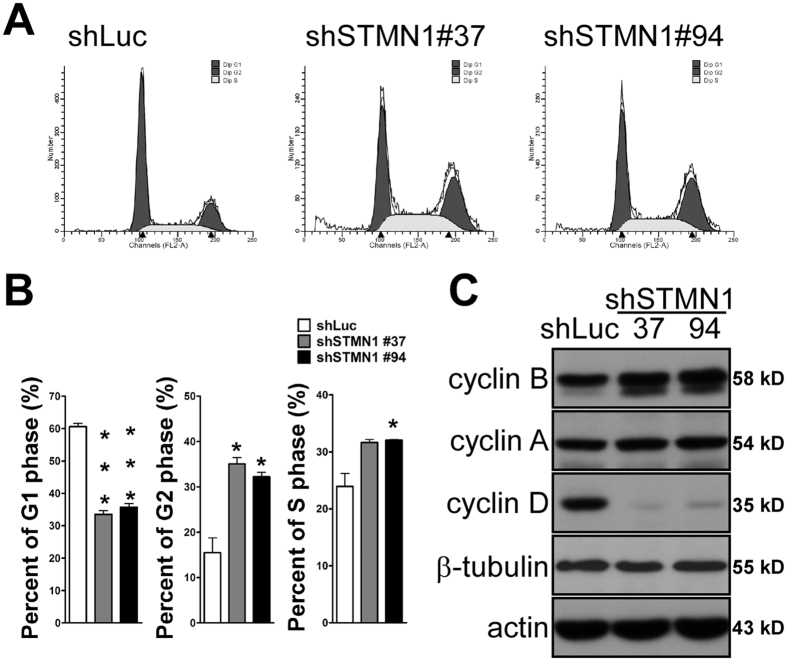
Figure 6. Cell cycle was redistributed in the knockdown of STMN1.
(A) J7-shSTMN1 and control cells were grown to desired confluence. Cells were then trypsinized, fixed and stained with PI. DNA contents were analyzed by flow cytometry. Percent of cell cycle distributions were presented in (B). Error bars, s.e.m. (n = 3). (C) Immunoblots of J7-shSTMN1 and J7-shLuc cells. Gel electrophoresis was conducted under the same experimental conditions, and images of blots were cropped. Uncropped blot images are shown in Supplementary Fig. S3A.

