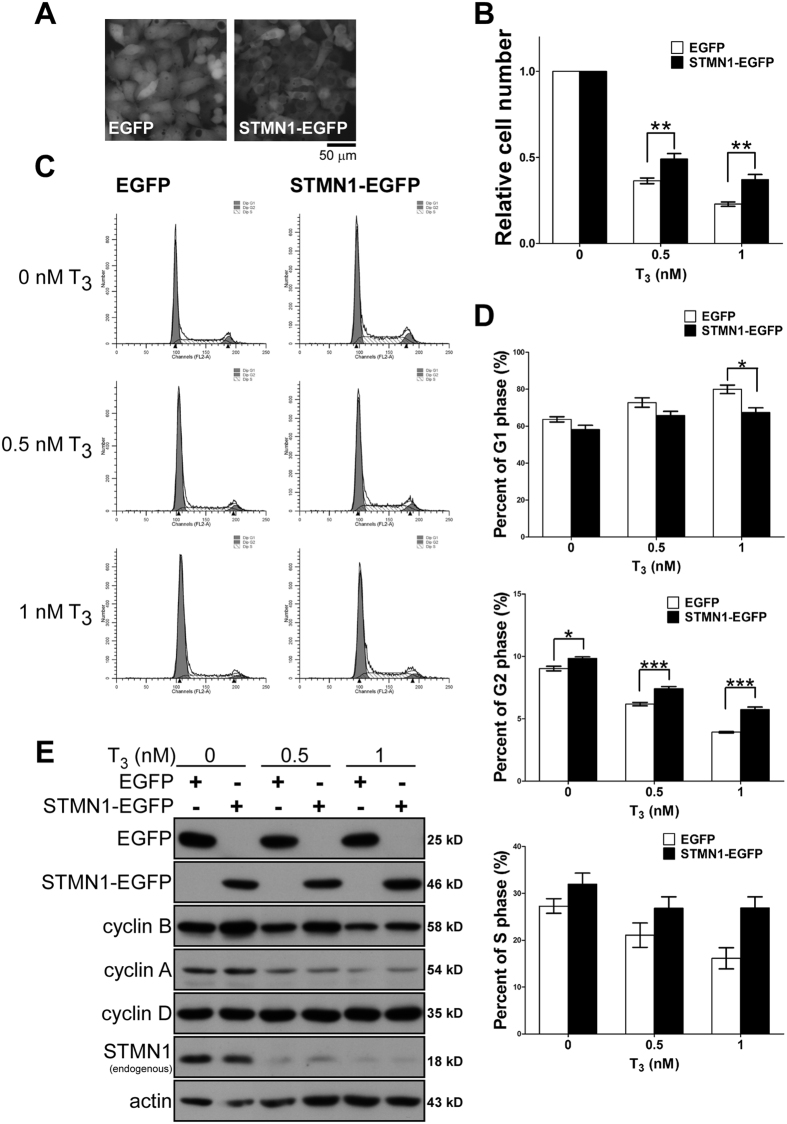
Figure 7. Overexpression of STMN1 attenuates T3-suppressed cell growth.
(A) Fluorescent image of stable expressing STMN1-GFP fusion protein in HepG2-THRA cell. (B) Cell growth in the absent or present of T3 for 4 days were analyzed. The relative folds of T3-suppressed growth of each individual clone were normalized by 0 nM T3. (C) The STMN1 overexpressing and control cells were analyzed by flow cytometry. Percent of cell cycle distributions were presented in (D). (***P < 0.001; **P < 0.01; *P < 0.05 n = 3). Error bars, s.e.m. (E) Immunoblots of STMN1-EGFP and EGFP stable expressing cells in the absent or present of 4 days T3 treatment. Gel electrophoresis was conducted under the same experimental conditions, and images of blots were cropped. Uncropped blot images are shown in Supplementary Fig. S3B.

