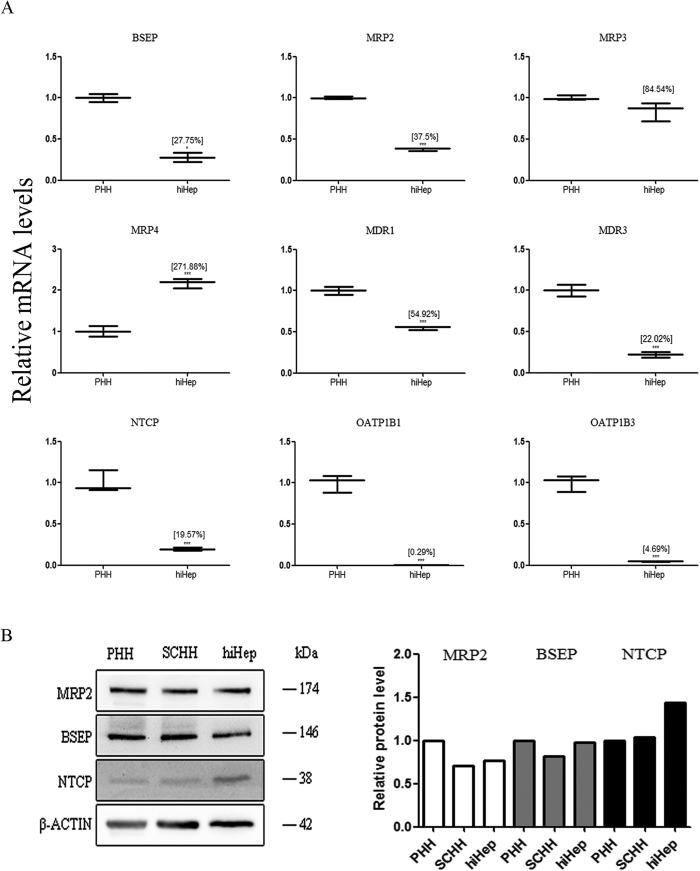
Figure 2. The expression levels of BA transporters in hiHeps and human hepatocytes.
(A) The mRNA levels of BA efflux (i.e., BSEP, MRPs and MDRs) and influx (i.e., NTCP, OATP1B1 and OATP1B3) transporters in hiHeps determined by qRT-PCR. The data are expressed as the mean ± SD (n = 3). *p < 0.05 relative to PHHs. (B) Comparison of the protein expression levels of MRP2, BSEP and NTCP among hiHeps, PHHs and SCHHs by western blotting (left) and gray intensity analysis (right). β-ACTIN was used as a reference control.

