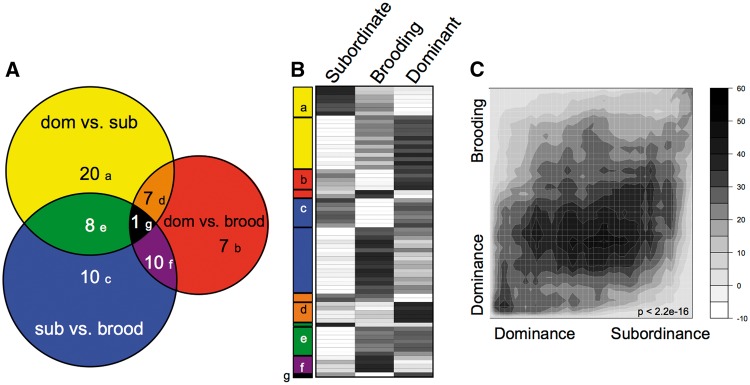
Fig. 1.
Socially regulated and reproductively regulated neural gene expression in A. burtoni females. (A) Scaled Venn diagram depicts overlap of differentially expressed genes (P < 0.05 FDR) for each pair-wise comparison in this study (P < 0.05 FDR; Supplementary Table 1). (B) Heatmap indicates the relative expression level (black: high; white: low) in each phenotype for these 70 differentially expressed genes, grouped according to the Venn diagram modules and further subdivided by direction of regulation within the module. (C) Rank-rank hypergeometric map demonstrates an overall correlation between the gene expression profile for dominance compared with subordinance and to the brooding reproductive phenotype. Scale bar depicts the relative range of BY-corrected, −log10 transformed hypergeometric P-values for the RRHO analysis. P-value indicates Spearman rank correlation of the fold-change data.

