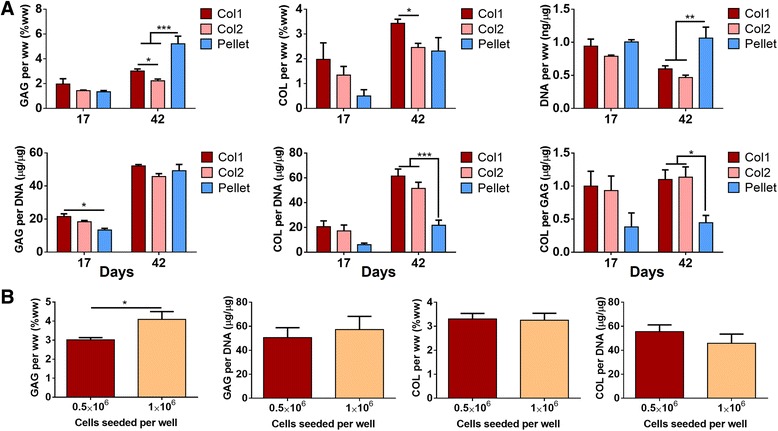
Fig. 4.

Biochemical quantification of glycosaminoglycan (GAG), collagen (COL) and cellular (DNA) contents. a Comparisons of type I collagen (Col1) discs, type II collagen (Col2) discs and pellets after 17 days or 42 days of chondrogenic induction. At day 42, pellets exhibited higher GAG and DNA contents (per wet weight) and discs exhibited higher COL/DNA and COL/GAG ratios; Col1 discs had higher GAG and DNA contents than Col2 discs. b Comparisons of Col1 discs at different seeding densities. Doubling seeding density from 0.5 × 10⁶ to 1.0 × 10⁶ increased GAG content (per wet weight) but not COL content. Only successfully formed discs were evaluated in the Col1 and Col2 groups
