
Fig. 5.
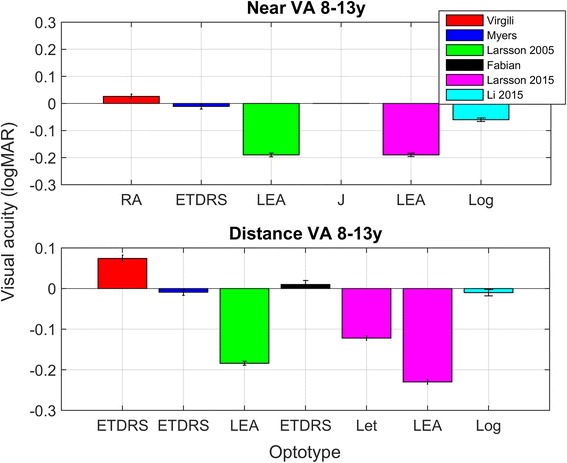
Near and distance visual acuity in 8–13 year olds with normal vision. As can be seen in this Figure, there was quite some variation in outcome. This variation can be due to differences in population characteristics across studies. Note that in the Larsson study, distance letter acuity was 0.11 logMAR poorer for letters than symbols. RA = reading acuity measured with the Italian version of MNREAD chart, ETDRS = ETDRS chart, LEA = Lea symbols, J = Jaeger chart, Log = LogMAR chart (type not specified). Error bars ± 1 sem