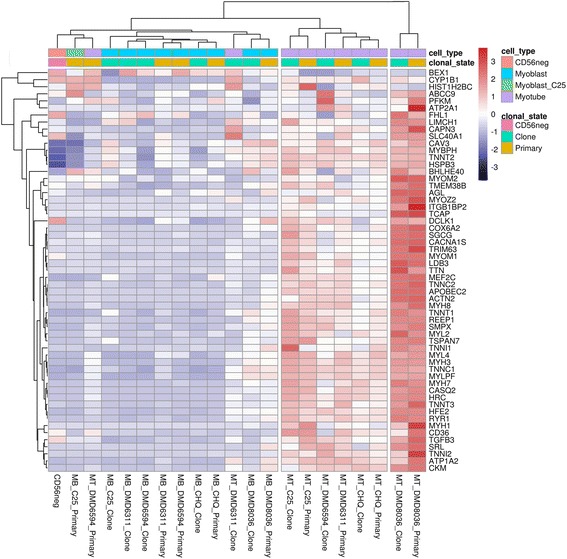
Fig. 4.

Heatmap showing the expression levels in immortalized and primary myogenic human lines of genes that are consistently and strongly upregulated in a panel of previous studies of myoblast differentiation. A gene is shown if it was among the 300 most strongly upregulated after five or more days of differentiation in at least three of four studies of human and mouse primary myoblasts, and C2C12 myoblasts. Expression values are row scaled. Hierarchical clustering analysis of the cell lines and genes are indicated by branches at top and left, respectively. Cell type and differentiation state are indicated by the cell_type bar at top. Immortalized clones, primary myogenic cells, and non-myogenic cells are indicated by the clonal_state bar at top
