Fig. 1.

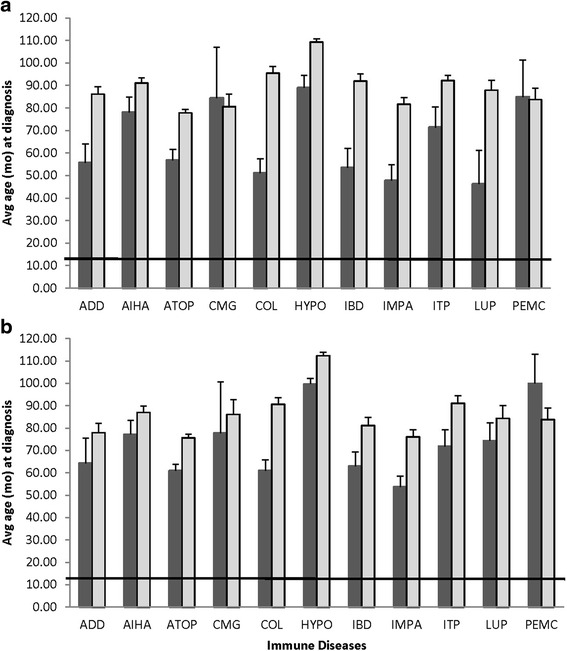
Age at disease diagnosis (mean and standard error of the mean) relative to sex category for females (a) and males (b). The solid horizontal line indicates the median age at neuter

Age at disease diagnosis (mean and standard error of the mean) relative to sex category for females (a) and males (b). The solid horizontal line indicates the median age at neuter