Fig. 2.

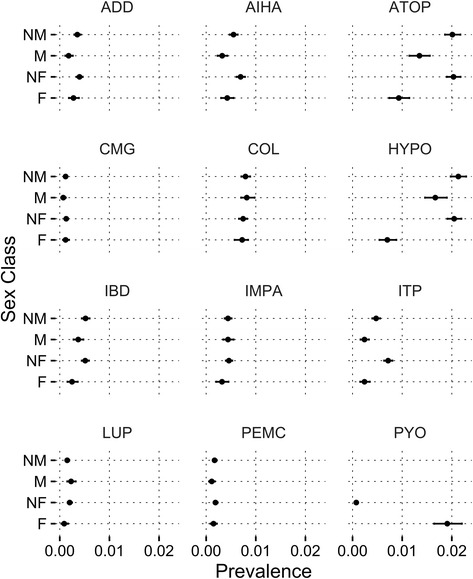
Caterpillar plot of the predicted probability that a dog would have each of the ten immune conditions based on neuter category parameters (data presented as mean probability ± 95% confidence interval)

Caterpillar plot of the predicted probability that a dog would have each of the ten immune conditions based on neuter category parameters (data presented as mean probability ± 95% confidence interval)