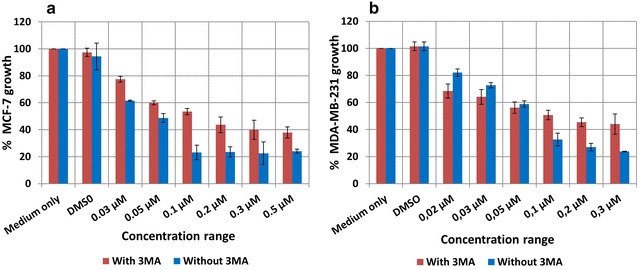
Fig. 2.

Cytotoxicity study for ESE-15-ol with/without 3MA over a 24 h exposure period in MCF-7 and MDA-MB-231 breast cancer cells. a The dose dependent curve for MCF-7 cells showed an IG50 of 0.15 μM for ESE-15-ol with 3MA and 0.05 μM for ESE-15-ol only (P-value = 0.007); b MDA-MB-231 cells showed an IG50 of 0.13 μM for ESE-15-ol with 3MA and 0.065 μM for ESE-15-ol only (P-value = 0.0195). Bars indicate averages of three independent biological repeats, each with n = 3. Error bars represent standard deviation
