Fig. 7.

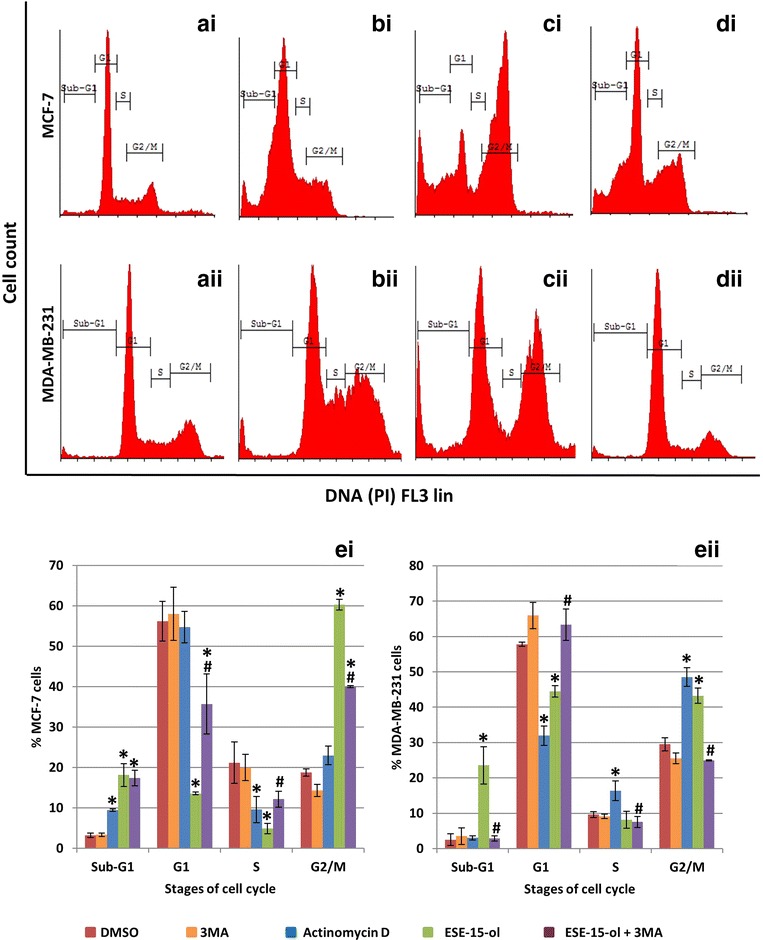
Cell cycle analysis of MCF-7 and MDA-MB231 cells exposed to ESE-15-ol with- and without 3MA. Cells were exposed to DMSO as a negative vehicle control (ai, aii) which showed a prominent G1 phase. Actinomycin D (bi, bii) was used as a positive control for apoptosis which resulted in an increase in the sub-G1 phase. An increase in the G2/M phase was seen in ESE-15-ol-treated cells (ci, cii) with a concurrent decrease in the G1 phase. ESE-15-ol treated cells together with 3MA (di, dii) showed a decrease in the G2/M phase with an increase in the G1 phase. Graphical representation of ei MCF-7 and eii MDA-MB-231 cell cycle analysis. ESE-15-ol-treated cells together with 3MA demonstrated an increase in the G1 phase when compared to ESE-15-ol-treated cells (P value <0.05; standard deviation represented by T-bars; *indicates statistical difference between compounds and DMSO vehicle control; #indicates statistical difference between ESE-15-ol and ESE-15-ol with 3MA)
