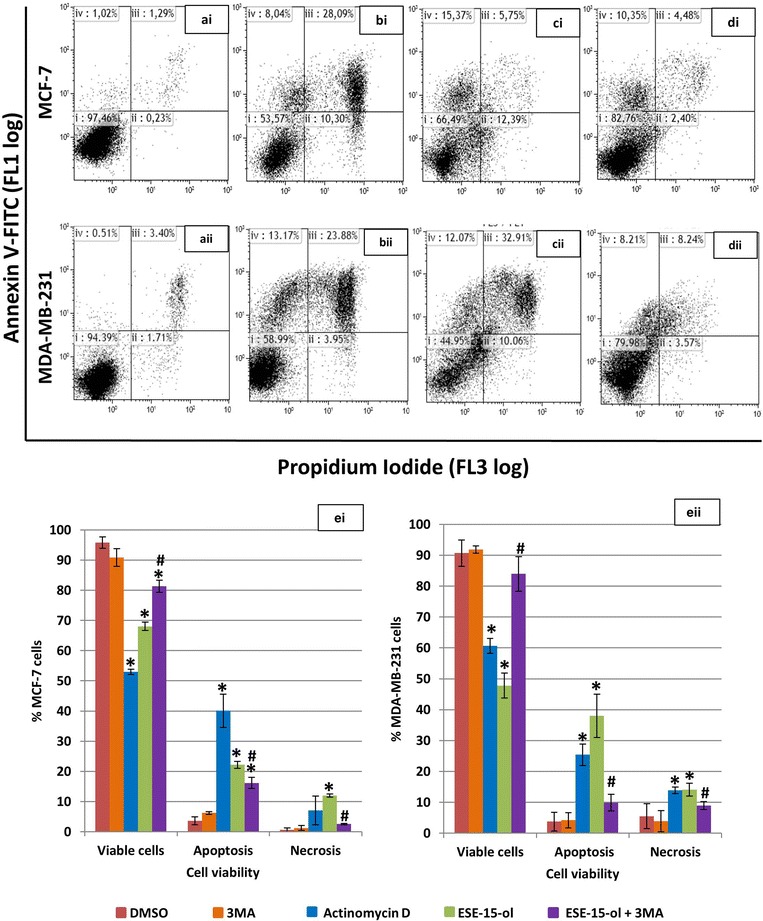
Fig. 8.

Annexin-V FITC flow cytometric analysis of cell viability. Dot blots of i MCF-7 and ii MDA-MB-231 cells exposed to a DMSO as a vehicle control and demonstrated a viable cell population. Dot blots of b actinomycin D (positive apoptosis control) and c ESE-15-ol-treated cells showed increased cell death via apoptosis. d ESE-15-ol-treated cells with 3MA showed increased cell viability when compared to cells exposed to ESE-15-ol only. Graphical representation of (ei) MCF-7 and (eii) MDA-MB-231 cells showed a decrease in cell viability in cells treated with ESE-15-ol when compared to DMSO. An increase in viable cells is observed in ESE-15-ol treated cells with 3MA when compared to ESE-15-ol treated cells. Bars represent averages of three biological repeats (P value <0.05; standard deviations represented by T-bars; *indicates statistical difference between compounds and DMSO vehicle control; #indicates statistical difference between ESE-15-ol and ESE-15-ol with 3MA) (Dot plot keys: i = viable cells; ii = necrosis; iii = late apoptosis; iv early apoptosis)
