
Fig. 1.
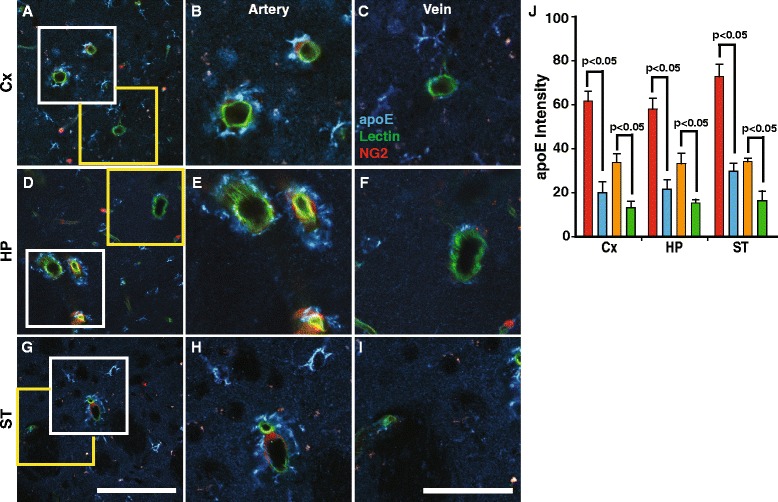
Greater levels of arterial endogenous mouse apoE than that on veins. Representative images of arteries and veins in brain regions (a, d and g at low magnification. Scale bar (100 μm). b cortical arteries with NG2-DsRed positive smooth muscle cells immunostained for apoE (blue) and (c) cortical vein lacking smooth muscle cells and with little apoE. Scale bar (50 μm). Similar pattern of apoE immunolabeling on arteries (e and h) and veins (f and i) in the hippocampus (d-f) and striatum (g-i). Blue, apoE; red, NG2-dsRed; green, Lectin. j Quantification of the apoE intensities on the vessel wall and around (a 5 μm circle around the vessel) arteries and veins in the different brain regions (cortex (Cx), hippocampus (HP) and striatum (ST)). Arterial wall (red column), peri-arterial (orange), vein (blue), peri-venous (green). White box (arterial vessels). Yellow box (venous vessels) Values are mean ± SEM. N = 4 mice per group