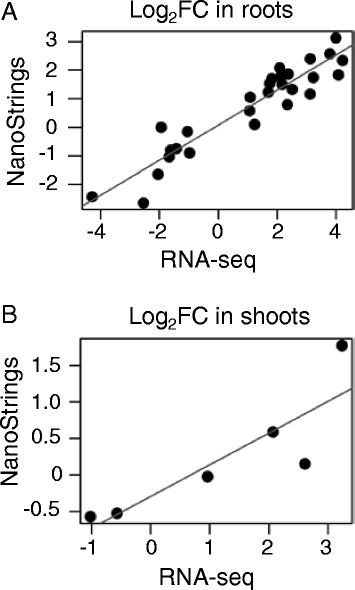
Fig. 2.

Comparison of gene expression changes detected by NanoStrings and RNA-Seq. Expression of cytokinin-responsive genes in roots (a) and shoots (b) was assayed using RNA-Seq and Nanostrings on treated samples from two separate experiments. The log2 fold change between BA-treated and mock-treated samples was calculated from three biological replicates. Linear regression lines are shown in red. R2 was 0.89 and 0.74 for the root and shoot, respectively
