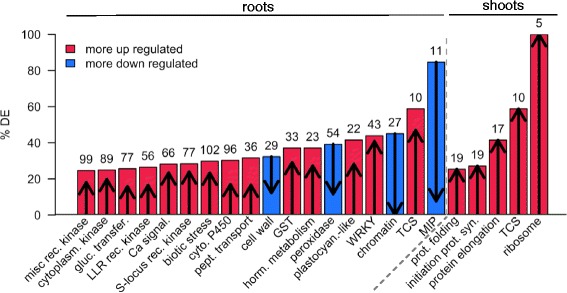
Fig. 5.

MapMan categories enriched in cytokinin-responsive genes in rice tissues. Representation of the MapMan categories enriched in the number of cytokinin-regulated genes in rice roots (left) and shoots (right). The numbers (above each bar indicate the number of cytokinin-regulated genes per category. Arrow length and direction and bar shading indicate how many differential expressed genes were up-regulated (red bar, arrows pointing up) or down-regulated (blue bar, arrows pointing down). Categories are ordered by significance (FDR) with the most significant terms on the left. Only categories with FDR 0.001 or smaller are shown
