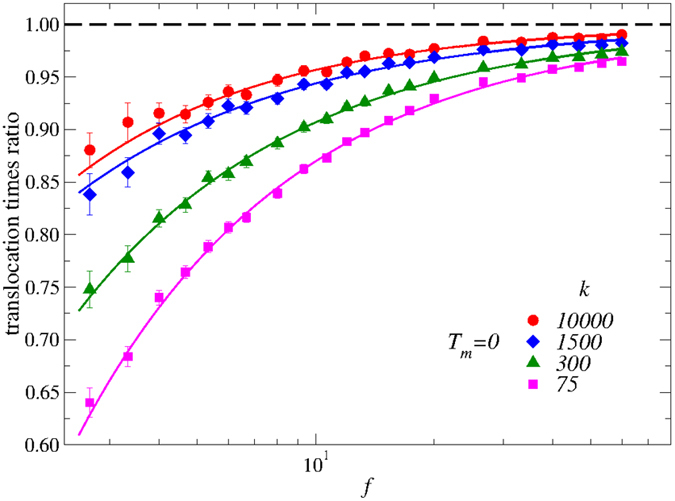
Figure 4. Renormalized average translocation time, τ* = τ(k, f)/τ(∞, f), at Tm = 0.

These data are the ratio of the average translocation time for different tethering (see main text) harmonic potential elastic constants k, to the fixed membrane (corresponding too k = ∞) reference value. The solid lines are guides for the eye, the dashed horizontal line is the reference value. The deformation of the nano-pore due to the direct interaction with the polymer beads reduces the average translocation time. The effect is stronger at lower values of f and increases by decreasing k. A discussion of these data is included in the main text.
