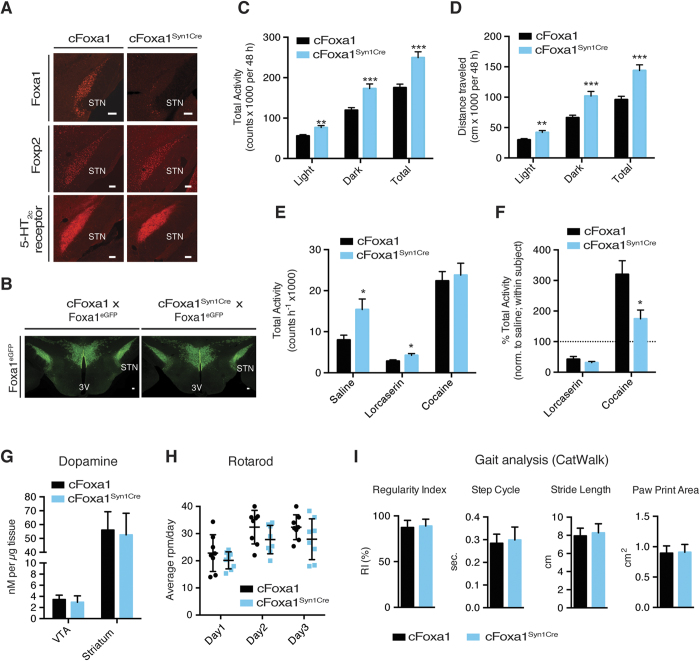
Figure 3. Central ablation of Foxa1 induces hyperlocomotion in adult mice.
(A,B) Immunohistochemical analysis of (A) Foxa1, Htr2c and Foxp2 or (B) Foxa1eGFP on brain sections from adult mice after Syn1Cre-mediated ablation of Foxa1. Shown are representative images. (C,D) Spontaneous locomotor measures of cFoxa1 and cFoxa1Syn1Cre male mice at 20 weeks (n = 16). (C) Total horizontal activity and (D) traveled distance were calculated from the number of photobeam interruptions over 48 h. (E,F) (E) Drug-modulated activity of 24 weeks old cFoxa1 and cFoxa1Syn1Cre male mice after intraperitoneal injection of saline, lorcaserin (7.5 mg/kg) or cocaine (10 mg/kg), using a within-subject experimental design. Activity was recorded in 5-min intervals for 60 min during the dark cycle (n = 8). (F) Normalized to saline treatment for each mouse individually. (G) Dopamine tissue content in VTA and striatum of male mice at 24 weeks (n = 8). (H) Crude motor coordination assessment on accelerating rotarod, presented as mean of the rounds per min (rpm) reached in three trials per day per animal on three consecutive days at 24 weeks (n = 8). (I) Gait analysis on the CatWalk system (Noldus) at 26 weeks. All mice had to cross a predefined area for three times and calculations were performed by averaging the measurements from all four legs (n = 8). 3V (third ventricle), STN (subthalamic nucleus). Numbers are per genotype. Values are expressed as mean ± SEM (C–F), or mean ± s.d. (G–I), *P ≤ 0.05, **P ≤ 0.01, ***P ≤ 0.001; two-tailed Student’s t-test (C–G,I) or 2-way RM ANOVA (H). Scale bars represent 100 μm.

