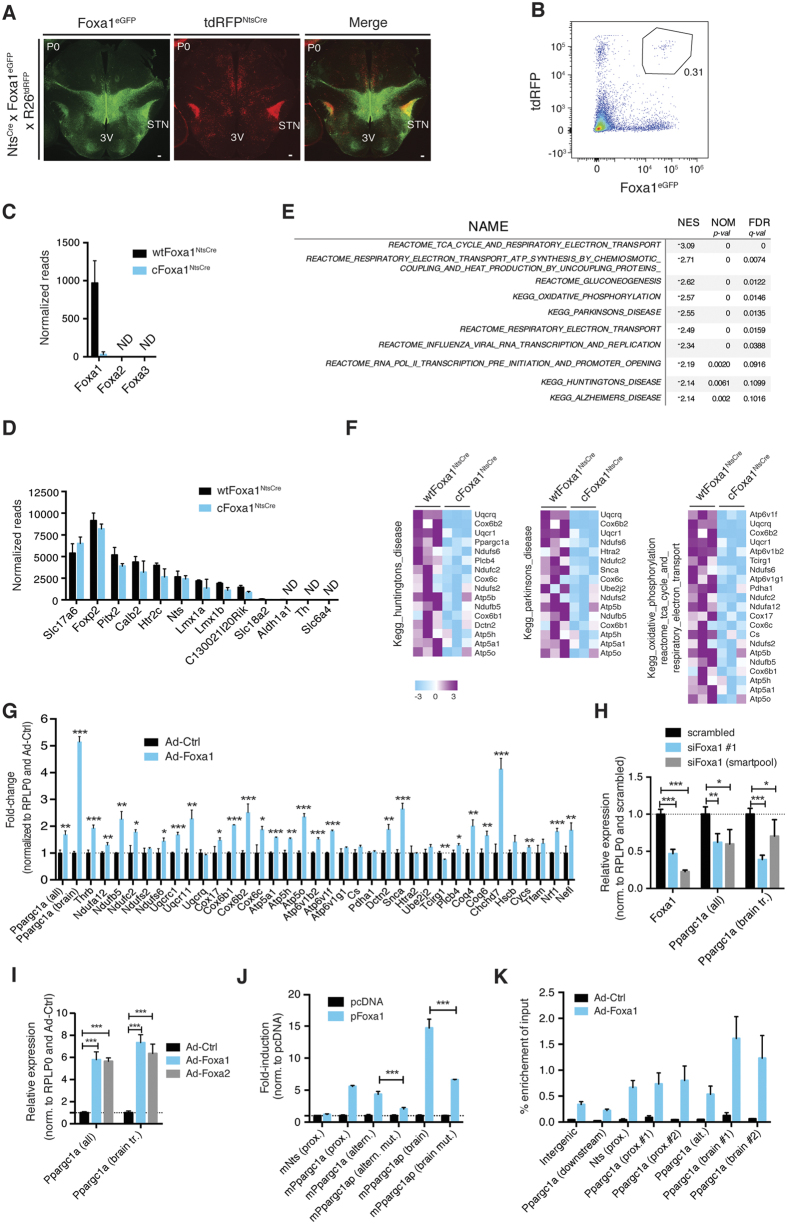
Figure 4. Transcriptional profiling of Foxa1-deficient STN neurons.
(A) Immunohistochemical analysis of Foxa1eGFP and R26-tdRFPNtsCre on coronal brain sections of P0 reporter mice. Shown are representative images. (B) Collection of STN neurons by flow cytometry for NGS from wtFoxa1NtsCre and cFoxa1NtsCre pups. Roughly 1000 STN cells were collected from one newborn for each biological replicate. Shown is a representative FACS dot plot. (C) Normalized NGS reads for Foxa1–3. Only Foxa1 reads that are not mapping to the Foxa1eGFP transgene were included in the analysis (n = 3). (D) Normalized NGS reads for selected NTS and VTA transcripts (n = 3). (E) Top significantly down-regulated pathways in Foxa1-deficient STN neurons, determined by pre-ranked GSEA. (F) Heatmap of genes involved in pathways commonly down-regulated in STN neurons from cFoxa1NtsCre versus wtFoxa1NtsCre pups, as determined by pre-ranked GSEA (n = 3). (G) RT-qPCR expression analysis of selected transcripts in primary neurons (DIV4) after overexpression of AdCtrl or AdFoxa1 (MOI = 50) (n = 3). Except Tfam, Cycs and Nrf1, all transcripts were significantly down-regulated in Foxa1-deficient STN neurons. Shown are data from one representative experiment. (H,I) RT-qPCR analysis of Ppargc1a transcript levels after (H) siRNA-mediated knockdown of Foxa1 or (I) adenoviral overexpression of Foxa1/2 in N2A cells (n = 4). Shown are data from one representative experiment. (L) Luciferase assays performed in HEK293T cells by co-transfecting the indicated promoter constructs with either pcDNA or pFoxa1 (n = 3). Shown are data from one representative experiment. Promoter sequence lengths relative to the corresponding transcriptional start sites are shown in the method section. (K) Foxa1 ChIP from N2a cells transduced with Ad-Ctrl or Ad-Foxa1. Percent recovery of input was calculated by RT-qPCR (n = 3). Shown are data from one representative experiment. The binding site positions relative to the corresponding transcriptional start sites are shown in the method section. 3V (third ventricle), STN (subthalamic nucleus). Numbers are per genotype or condition. All values are expressed as mean ± s.d., ND (not detected), *P ≤ 0.05, **P ≤ 0.01, ***P ≤ 0.001; two-tailed Student’s t-test. Scale bars: 100 μm.

