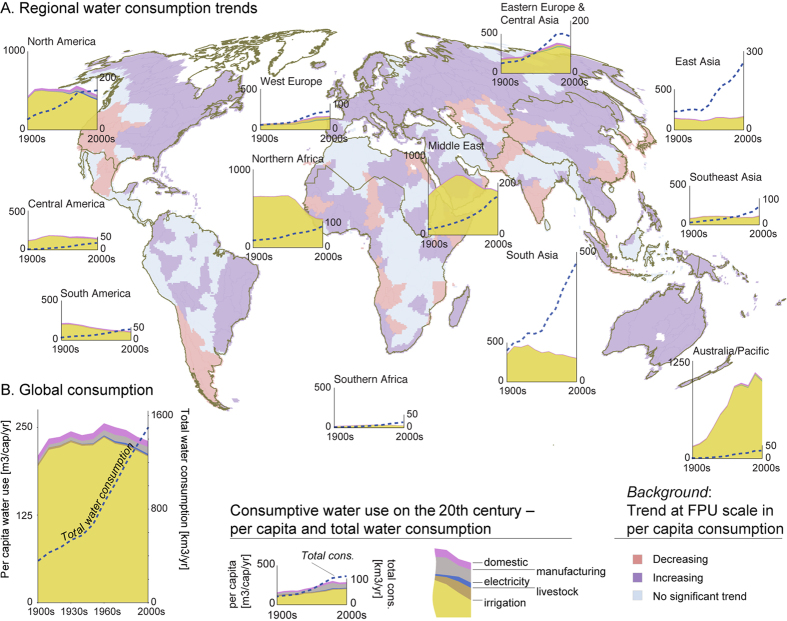
Figure 1.
Regional (A) and global (B) consumptive water use trends over the 20th century. The filled area represents per capita water consumption trends while the dashed line represents the total water consumption trends. The per capita consumption is divided into different water use sectors. The trend in per capita consumption at the FPU scale is shown as a background. [Adobe Illustrator CS5, ArcGIS 9.2 and Matlab 2015b softwares were used to create the figure; http://www.adobe.com/products/illustrator.html, http://www.esri.com, and http://www.mathworks.com].

