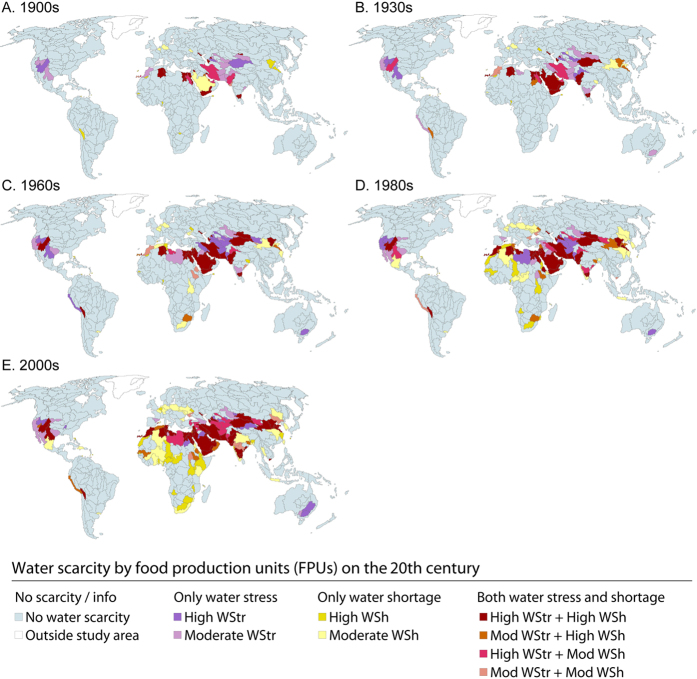
Figure 3.
Mapped water scarcity categories for years 1905 (A), 1935 (B), 1965 (C), 1985 (D), and 2005 (E). The definition for each scarcity category is given in Table 1 and Fig. 4A. [Adobe Illustrator CS5 and ArcGIS 9.2 softwares were used to create the figure; http://www.adobe.com/products/illustrator.html, http://www.esri.com].

