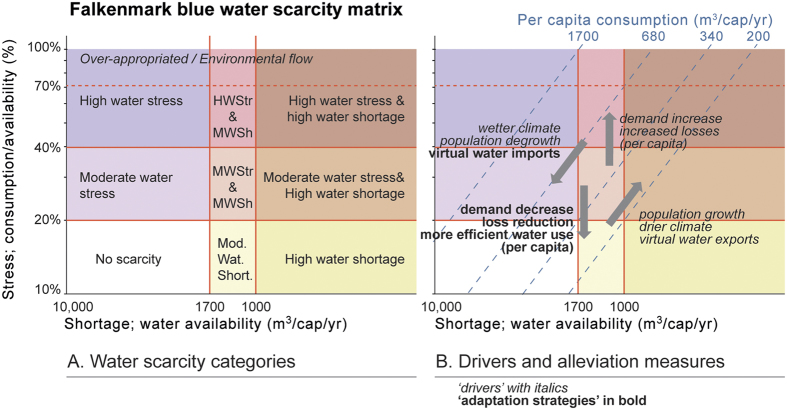
Figure 4. Water scarcity matrix (adapted from Falkenmark16 and Falkenmark et al.17).
(A) the water scarcity categories; and (B) Drivers and alleviation measures. The diagonal lines in tile B refer to per capita consumption isolines. [Adobe Illustrator CS5 –software was used to create the figure; http://www.adobe.com/products/illustrator.html].

