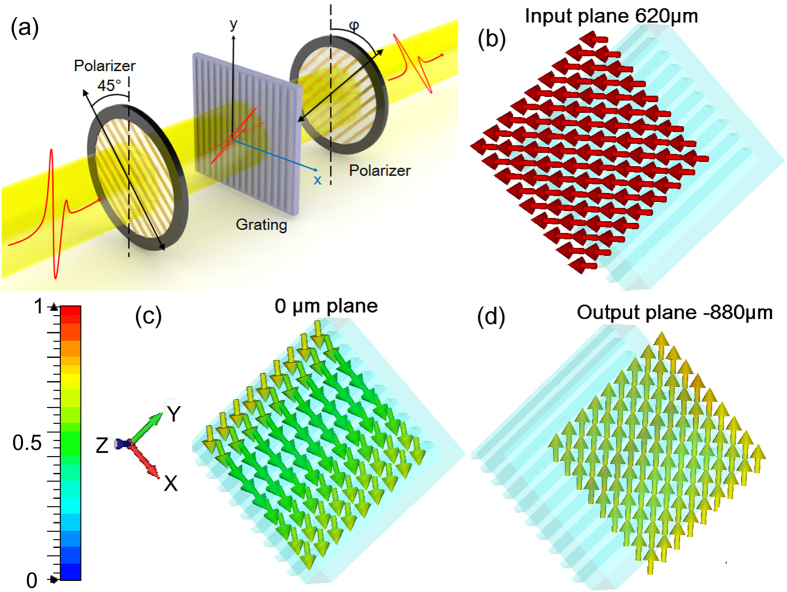
Figure 6.
(a) Schematic of the polarization conversion experiment configuration. (b–d) The distribution of the electic vectors at (b) the input plane (c) inside the dielectric grating and (d) at the output plane simluated with PGG at 1.05 THz. The arrows indicate the direction of the electic field vectors.

