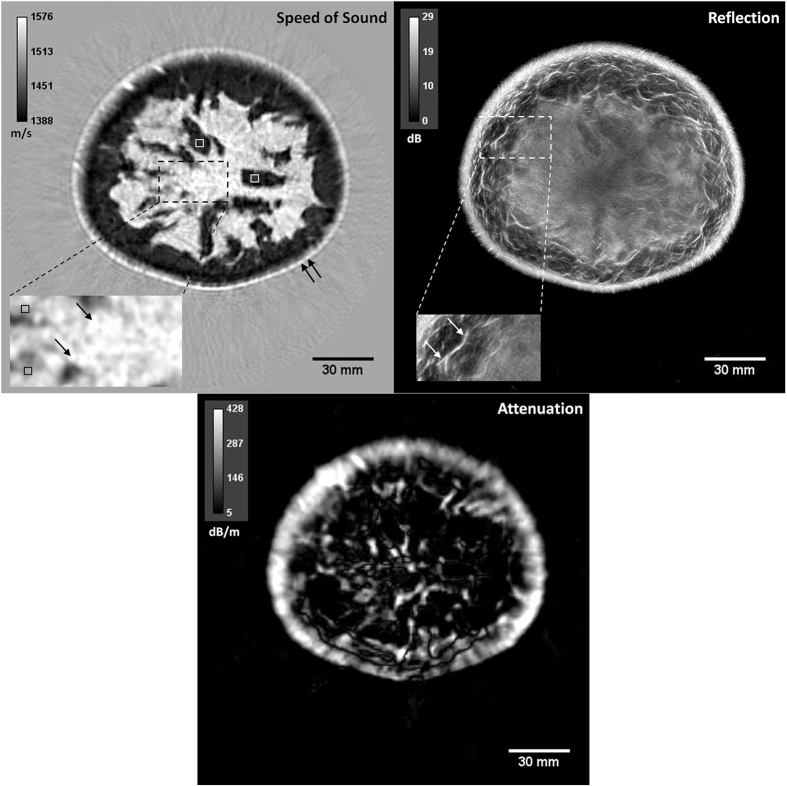
Figure 1. Representative multimodality QT ultrasound images of a volunteer’s breast.
Left: speed of sound, middle: attenuation, and right: reflection images. Example ROIs are identified within the images. Speed of sound image: The white and black squares in the speed of sound image mark fat and glandular tissue, respectively. Single and double black arrows mark ductal tissue and skin, respectively. Reflection image: Single white arrows mark the connective tissue identified as Cooper’s ligaments.

