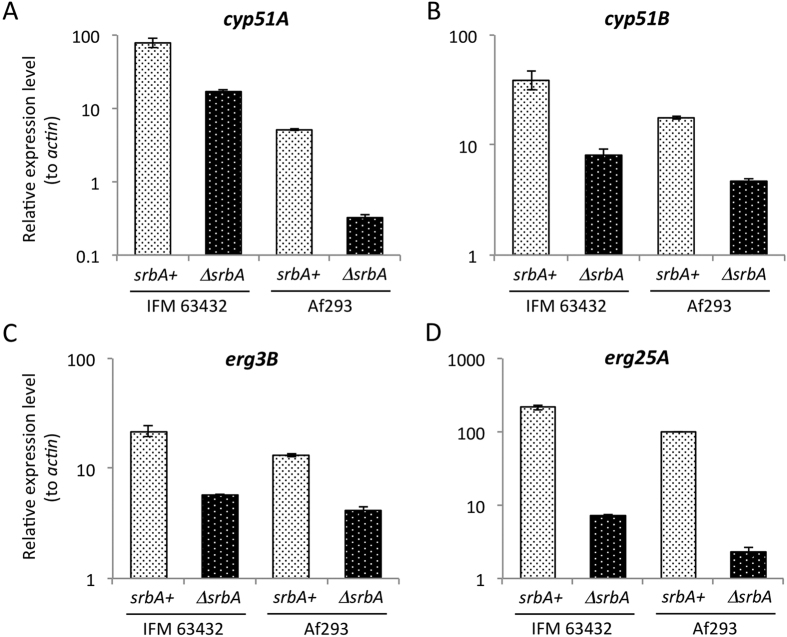
Figure 2. Expression analysis of IFM 63432 and Af293 and the srbA deletion mutants.
Expression levels of cyp51A (A), cyp51B (B), erg3B (C) and erg25A (D) were determined by qRT-PCR. The strains were cultivated in PDB for 16 h. The expression levels of the genes of interest were normalised against those of the actin gene. Relative expression ratios are shown. Error bars represent the standard deviations based on three independent replicates.

