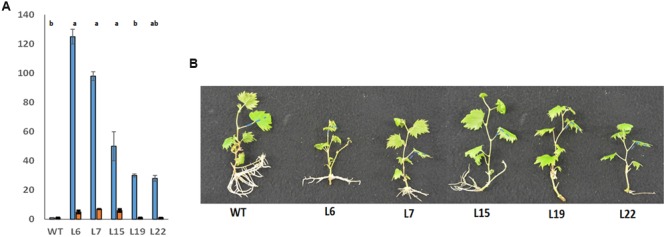
FIGURE 2.

Characterization of VviERF045 overexpressing lines. (A) Relative expression level of the endogenous + exogenous gene (blue bars), and endogenous gene (orange bars) in the transgenic lines. Error bars are based on data from three biological and two technical replicates. Data were normalized using ubiquitin and actin as reference genes. Relative expressions with the same letter are not significantly different (p < 0.05) according to Tuckey’s post hoc test. The ANOVA test refers to the red bars since for blue bars no significant difference was observed. (B) In vitro phenotype of transgenic and WT plants of the same age.
